Submit an Article
Navigate
Home
Editorial Board
Editorial Policies
Current Volume
Archive
Scientific Integrity
Publication Ethics Statements
Interviews with Outstanding Authors
Newsroom
Sponsored Conferences
Podcast
Contact
Special Collections
Submit an Article
Online ISSN: 1945-4589
Research Paper
|
Volume 12, Issue 22
|
pp. 23067–23081
CD138
-
multiple myeloma cells express high level of CHK1 which correlated to overall survival in MM patient
Back to article
Figure 3
(3 of 8)
−
100%
+
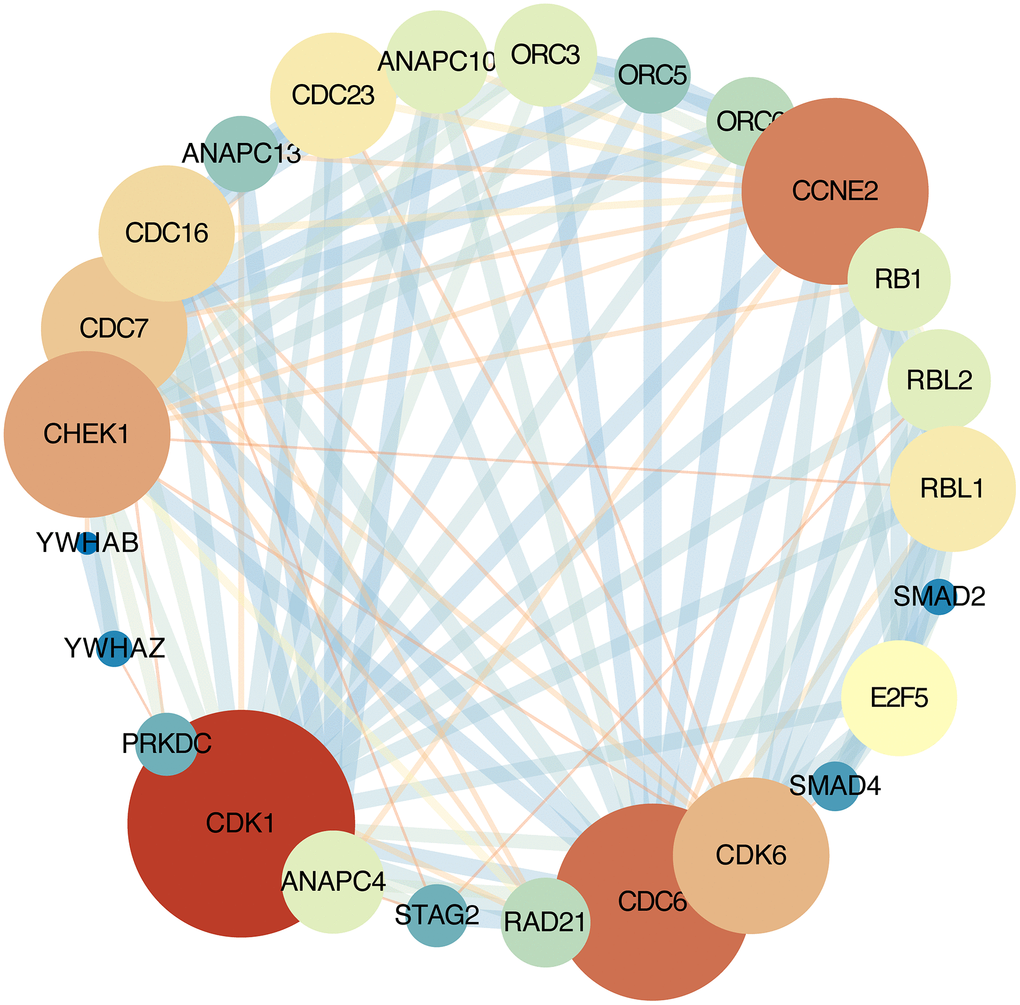
Figure 3.
Protein-protein interaction network.
Each node represents a gene; Node size represents the degree value; Edge size represents the combined score; Low value to blue and high value to red.