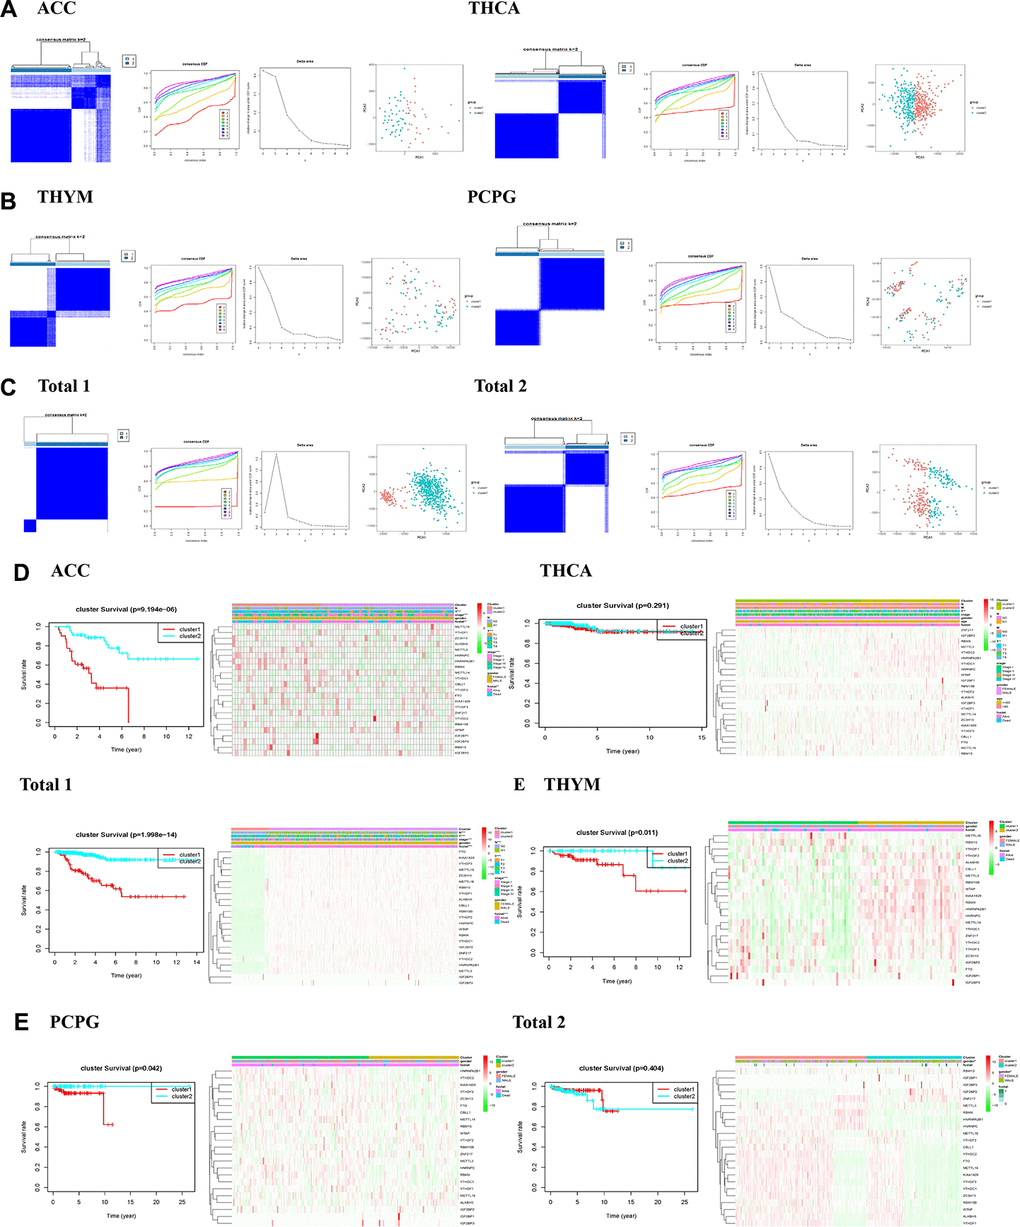
Figure 2.Identification of consensus clusters by m6A RNA methylation regulators in endocrine system tumors. (A–C) Consensus clustering matrix for k = 2, and consensus clustering cumulative distribution function (CDF) for k = 2 to 9, and relative change in area under CDF curve for k = 2–9, and principal component analysis (PCA) of total RNA expression profiles in tumors data from the cancer genome atlas (TCGA) dataset; (D, E) Heatmaps, and Kaplan–Meier overall survival (OS) curve and clinicopathologic features of two clusters defined by consistent expression of the m6A regulatory genes (clusters1/2).