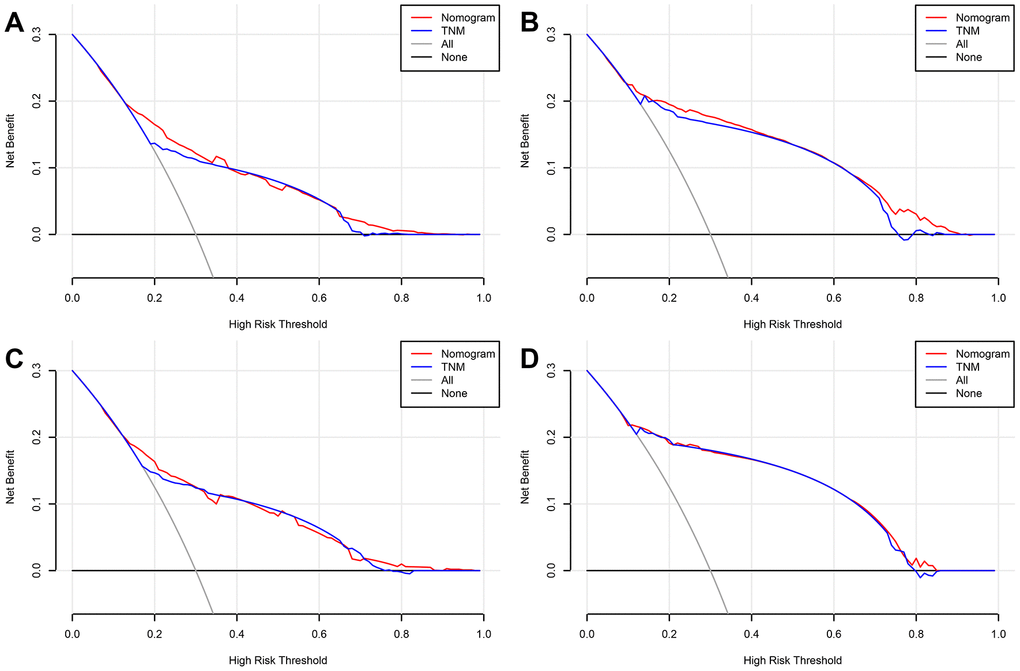
Figure 5.Decision curve analysis (DCA) curves detects the predictive value of two nomograms in GCTC prognosis. (A) Overall survival (OS) in the training cohort. (B) Cancer-specific survival (CSS) in the training cohort. (C) OS in the validation cohort. (D) CSS in the validation cohort.