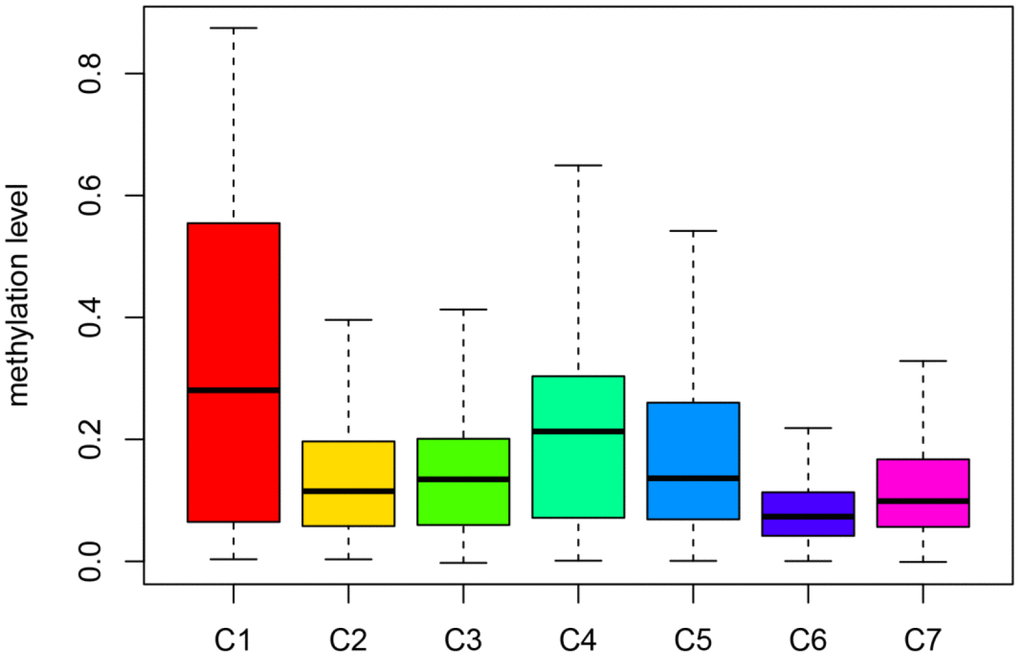
Figure 6.Box plot of CpG methylation levels of the 7 Clusters. Cluster 6 has the lowest CpG methylation level and Cluster 1 has the highest CpG methylation level.
Figure 6 — Molecular subtypes based on DNA promoter methylation predict prognosis in lung adenocarcinoma patients | Aging