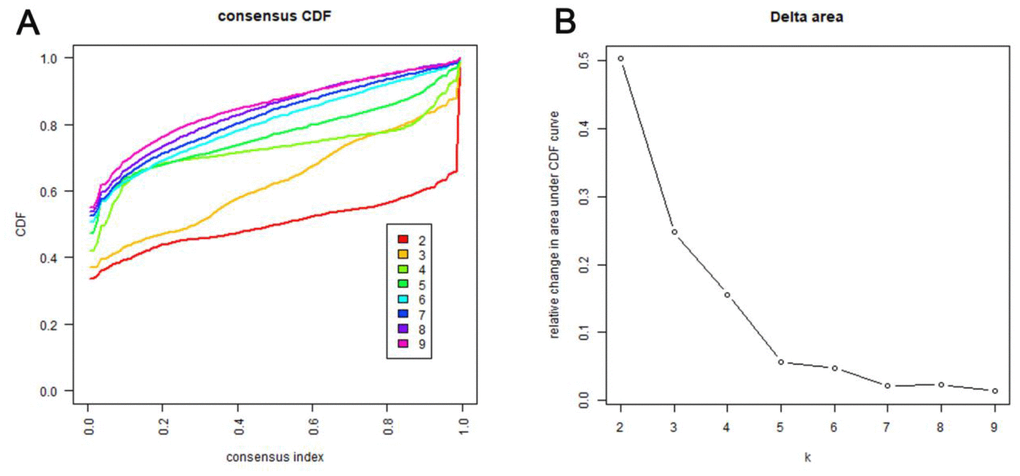
Figure 1.Criteria for selecting number of categories. (A) Consensus among clusters for each category number k. This graphic shows the cumulative distribution functions (CDF) of the consensus matrix for each k (indicated by colors), estimated by a histogram of 100 bins. This figure allows a user to determine at what number of clusters, k, the CDF each is an approximate maximum, thus consensus and cluster confidence is at a maximum at this k. (B) Delta area curves for consensus clustering indicating the relative change in area under the CDF curve for each category number k compared to k-1. The horizontal axis represents the category number k and the vertical axis represents the relative change in area under CDF curve. This plot allows users to determine the relative increase in consensus and determine k at which there is no appreciable increase.