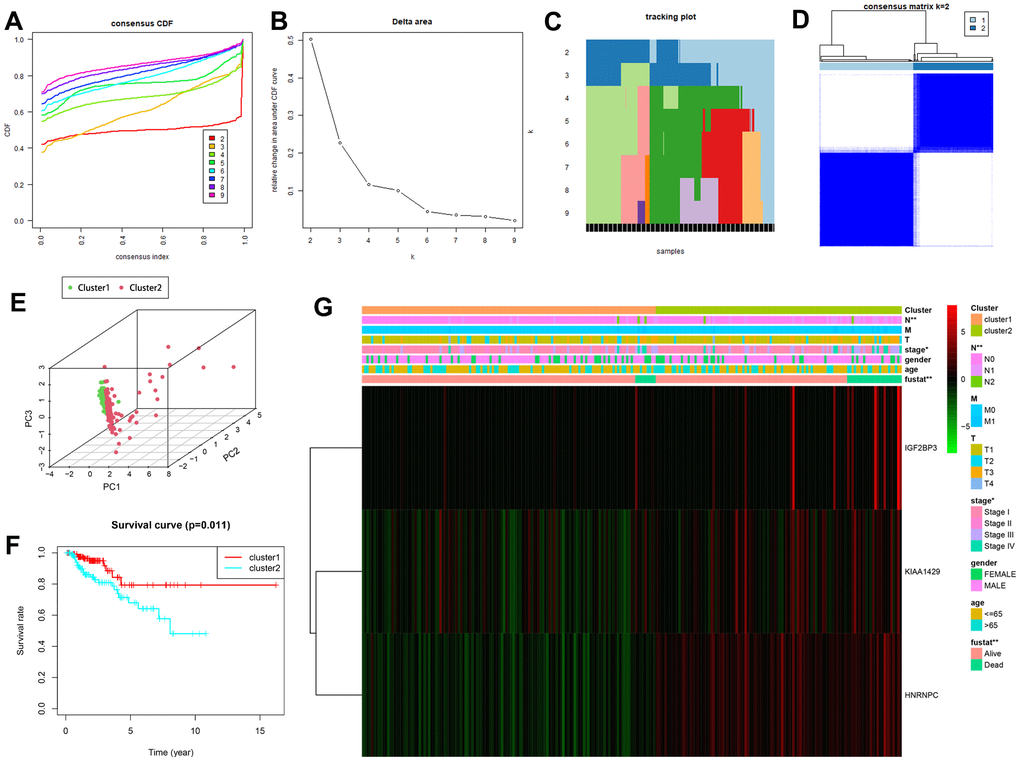
Figure 5.Consensus clustering analysis shows two clusters of KIRP patients with differential prognosis. (A) Cumulative distribution function (CDF) curves for the consensus score (k = 2 to 9). (B) Relative change in area under the CDF curve for k = 2 to 7. (C) The tracking plot for k = 2 to 9. (D) Consensus clustering matrix for the optimal cluster number, k = 2. (E) Principal component analysis shows the gene expression differences between clusters 1 and 2. (F) Kaplan-Meier survival curve analysis shows OS rates in cluster 1 and 2 KIRP patients. As shown, OS is significantly shorter for KIRP patients in cluster 2 compared to those in cluster 1. (G) The heatmap shows the expression of the three prognostic risk-related m6A methylation regulatory genes in cluster 1 and cluster 2 patients that were stratified according to the clinicopathological parameters, namely, survival status (alive or dead), age (>65 y or <65 y), gender (male or female), AJCC stages (stages I, II, III or IV), T stage (T1-T4), N stage (N0, N1 or N2), and M stage (M0 or M1). As shown, the expression of the three prognostic genes are significantly altered in cluster 1 and cluster 2 patients stratified based on the N stage, AJCC stage and the survival status. * P<0.05; ** P<0.01.