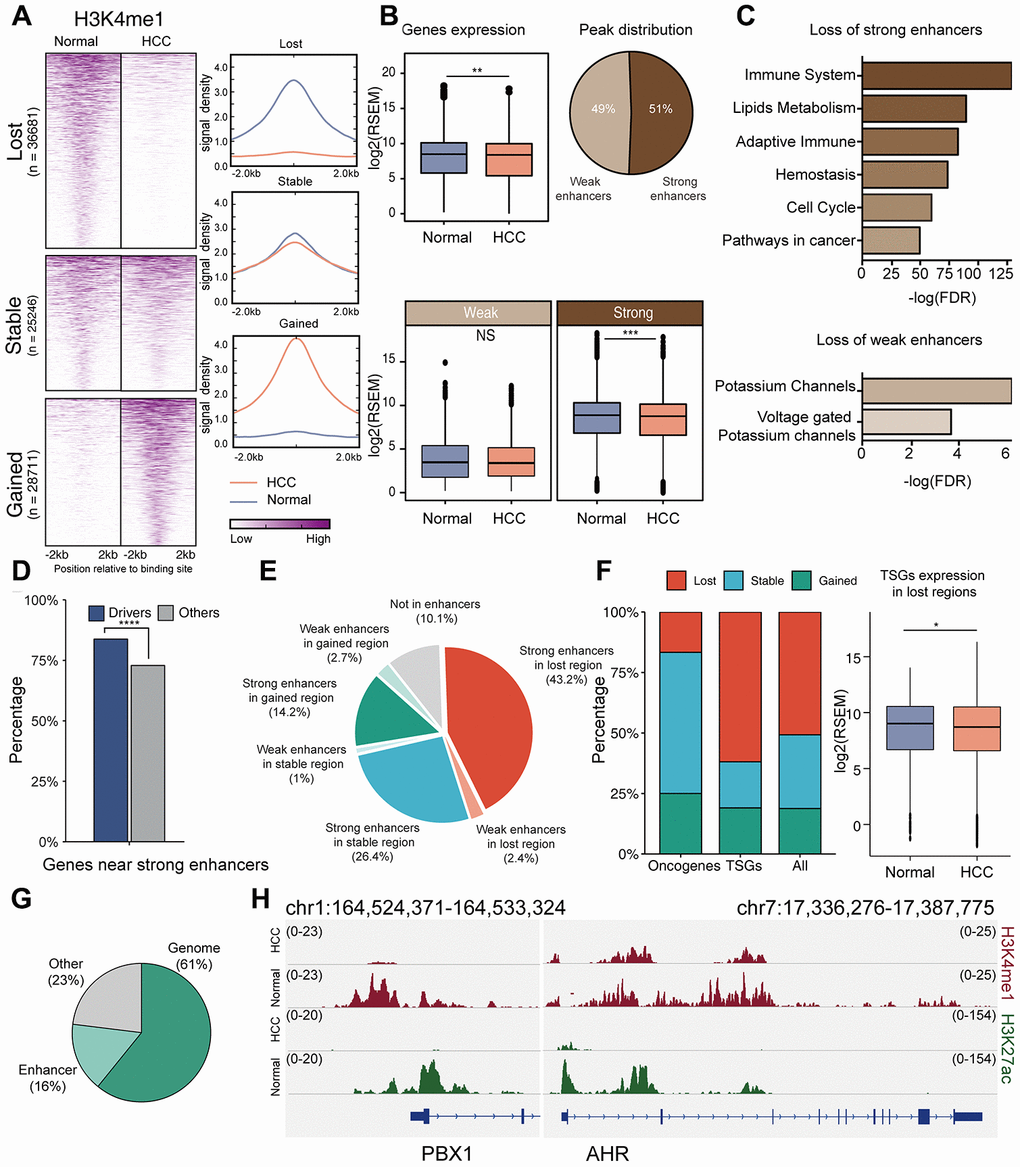
Figure 5.Role of enhancers in HCC. (A) Comparison of H3K4me1 signals in HCC cells (HepG2) and normal liver tissues. (B) Gene expression in enhancer loss regions in HCC and normal tissues. Enhancers were subdivided into strong and weak enhancers by H3K27ac signals. P value was determined by student’s t test: ***P < 0.001; **P < 0.01; *P < 0.05; NS:P ≥ 0.05. (C) Functional enrichment for genes associated with the inactivation of strong/weak enhancers. (D) Percentage of driver genes located in strong enhancers. P value was determined by chi-square test: ****P < 0.0001. (E) Distribution of drivers in different regions; the regions were divided according to the types of enhancers and their expression in HCC and normal tissues. (F) Comparison of enhancer alterations of oncogenes, TSGs and other drivers. (G) Proportion of drivers that change expression. “Genome” means proportion of drivers whose down-regulation may be caused by mutation, hyper-methylation, or copy number deletion; up-regulation may be caused by mutations or copy number amplification. “Enhancer” means proportion of drivers whose down-regulation may be caused by enhancer loss, and up-regulation may be caused by enhancer gain. (H) ChIP–seq signal tracks for H3K4me1 and H3K27ac in the regions around PBX1 and AHR.