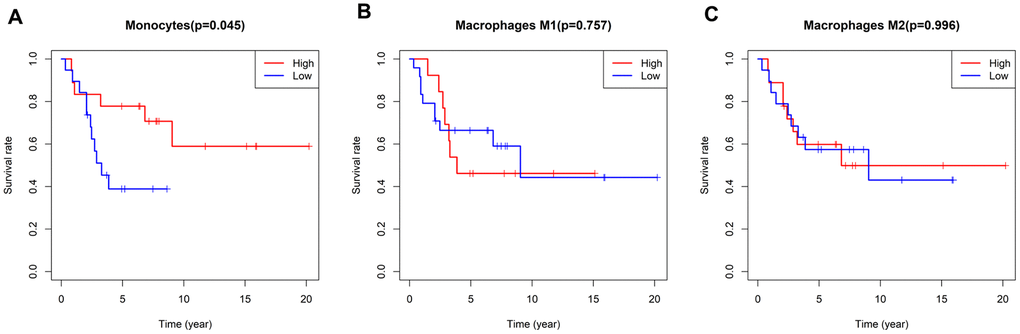
Figure 5.Survival plots based on the median proportions of specific immune cell subsets. (A) Kaplan-Meier curves showing the different survival rates in patients with high and low-densities of monocytes. (B, C) There were no differences in patients’ survival times according to the levels of M1 and M2 macrophages. The results were generated using the R software package survival.