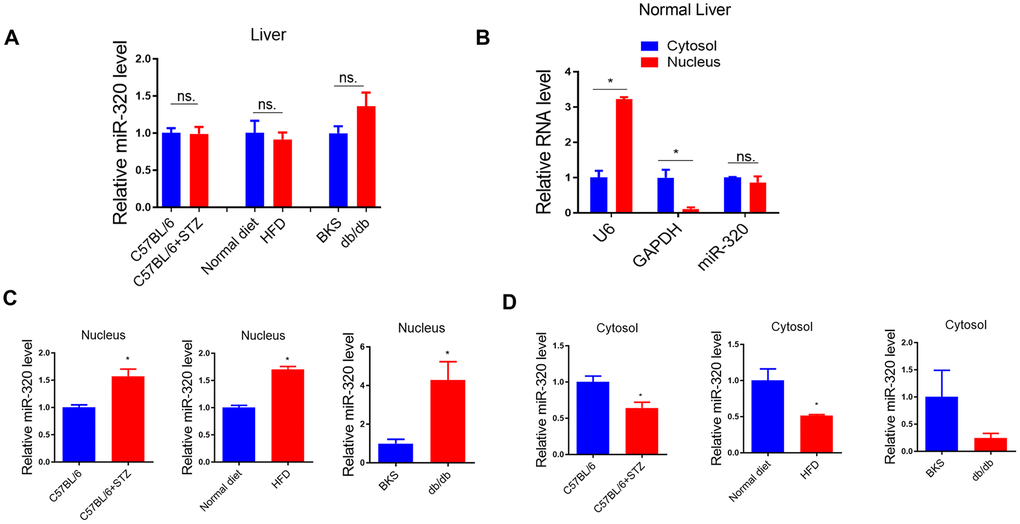
Figure 3.MiR-320 overexpression increased liver lipid content in differently treated mice. (A) MiR-320 levels in STZ-treated C57BL/6 mice, HFD-treated C57BL/6 mice, and db/db mice liver were determined by quantitative real-time PCR (n=6). (B) Cytoplasmic and nuclear miR-320 levels in normal mice liver were detected by cell fractionation followed by RT-qPCR. GAPDH mRNA and U6 RNA were served as cytoplasmic and nuclear markers. MiR-320 was similarly expressed in nucleus and cytoplasm (n=3, *p<0.05). (C, D) Cytoplasmic and nuclear miR-320 levels in STZ-treated C57BL/6 mice (B), HFD-treated C57BL/6 mice (C), and db/db mice (D) liver were determined using cell fractionation followed by quantitative real-time PCR (n=3, *p<0.05).
(E, F) Nuclear and cytosol miR-320 levels in miR-320 transgenic and rAAV-miR-320 treated mice were detected by quantitative real-time PCR (n=3, *p<0.05). (G) The effects of rAAV-miR-320 on lipid accumulation in liver determined by oil red staining in STZ-treated C57BL/6 mice. (H) Detection of lipid levels by oil red staining in miR-320 transgenic mice treated with HFD. (I) The effects of rAAV-miR-320 on lipid accumulation in liver determined by oil red staining in db/db mice.