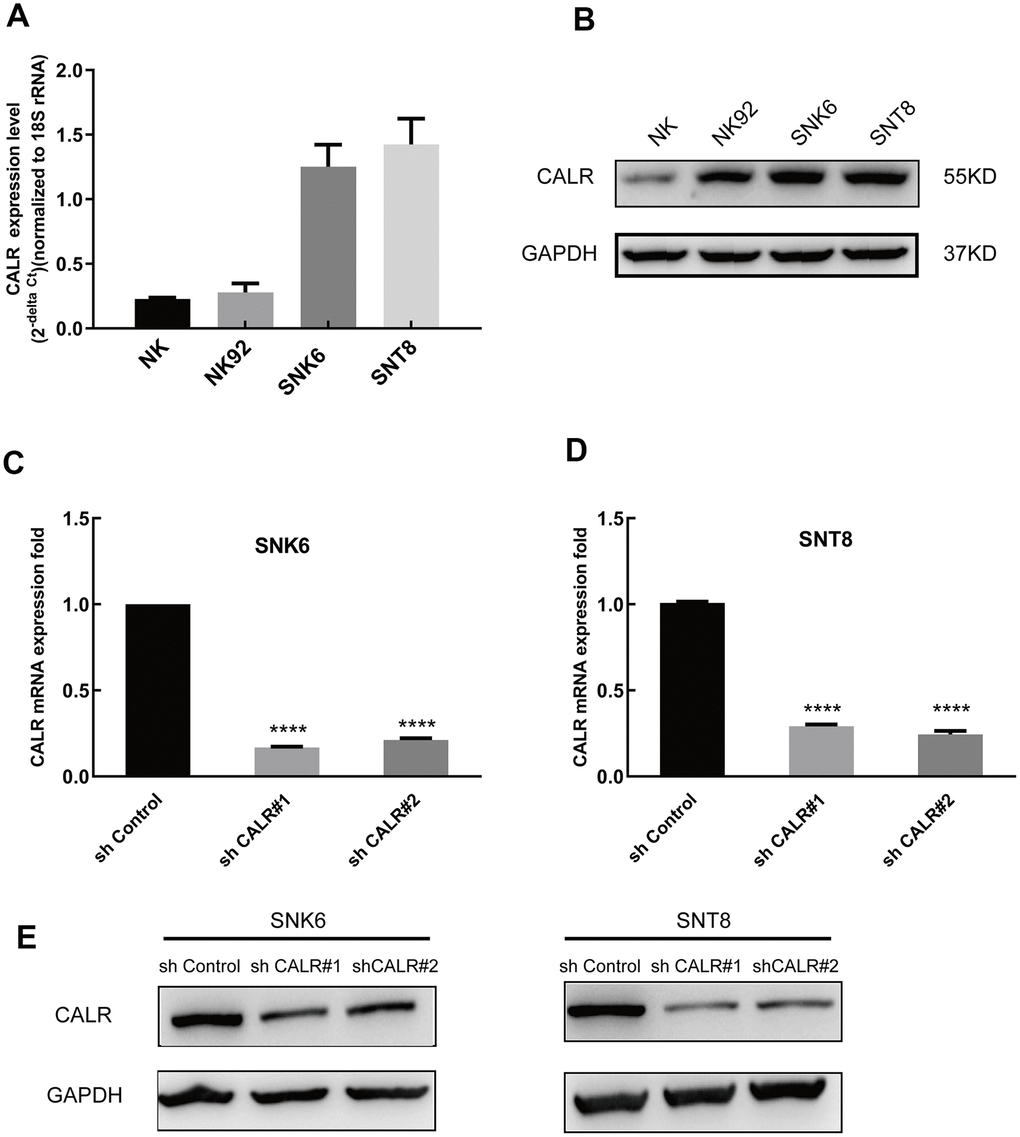
Figure 2.CALR expression is upregulated in the NKTCL cell lines. (A) Quantitative real time PCR analysis shows the CALR mRNA levels relative to 18S rRNA levels in the NKTCL cell lines (NK92, SNK6 and SNT8) and the normal NK cells. (B) Western blot analysis shows the CALR protein levels in the NKTCL cell lines (NK92, SNK6 and SNT8) and the normal NK cells. (C) Q-PCR analysis shows the CALR mRNA levels relative to 18S rRNA levels in the SNK6 cells transfected with shCALR#1, shCALR#2, shCALR#3, and shControl. (D) Q-PCR analysis shows the CALR mRNA levels relative to 18S rRNA levels in the SNT8 cells transfected with shCALR#1, shCALR#2, shCALR#3, and shControl. (E) Western blot analysis shows the CALR protein expression in SNK6 or SNT8 cells transfected with shCALR#1, shCALR#2, shCALR#3, and shControl. Note: **** P < 0.0001.