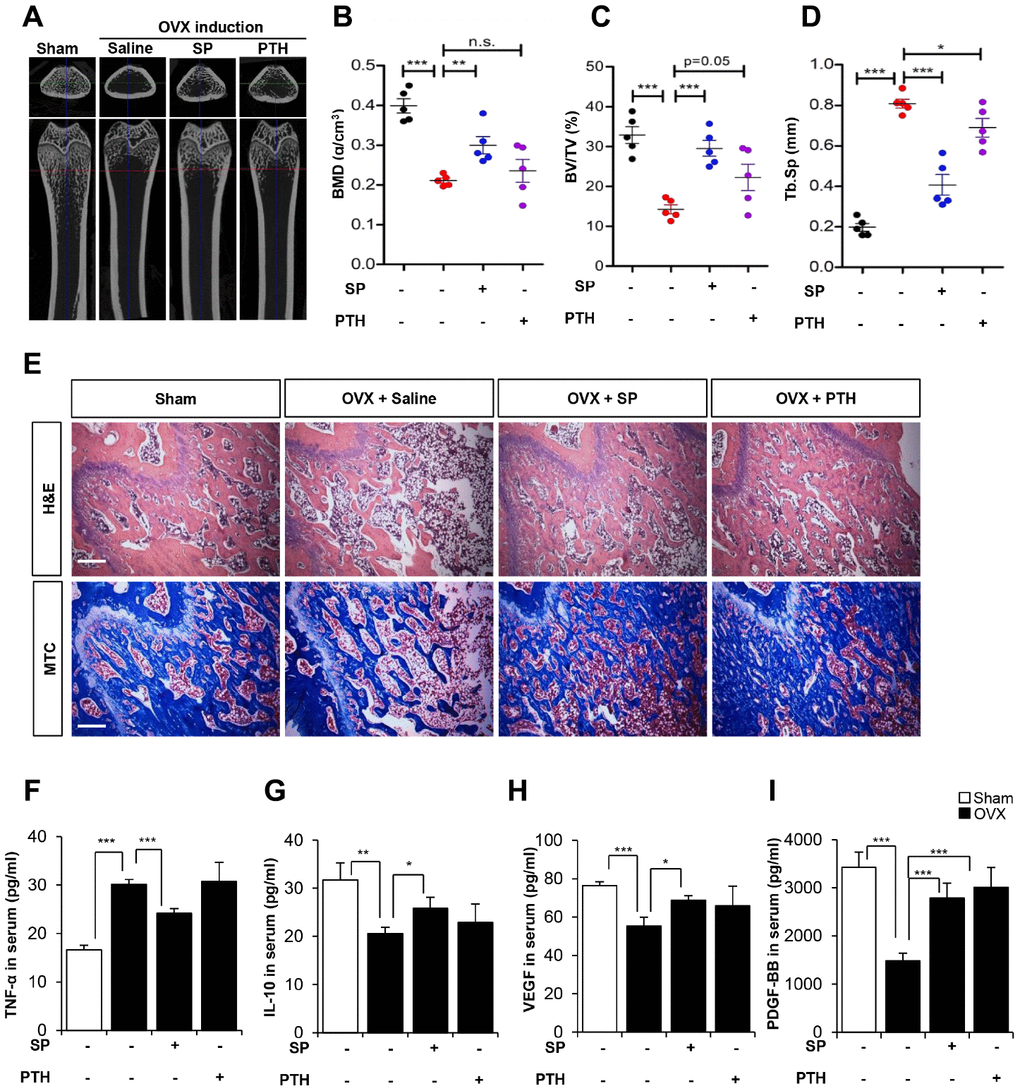
Figure 9.The efficacy of SP is superior to PTH therapy. (A) Representative femoral μCT images from each group. (B–D) Quantitative analyses of the trabecular bone fraction of femur from rats. (E) H&E and Masson’s Trichrome staining of distal femoral metaphysis regions. Scale bar: 100 μm. (F–I) The concentration of TNF-α, IL-10, VEGF and PDGF-BB in serum were analyzed by ELISA. BMD: bone mineral density. BV: trabecular bone volume. TV: tissue volume. Tb.Sp: trabecular bone spacing. p values of less than 0.05 were considered statistically significant (* p <0.05, ** p <0.01, *** p <0.001). n = 6/ group.