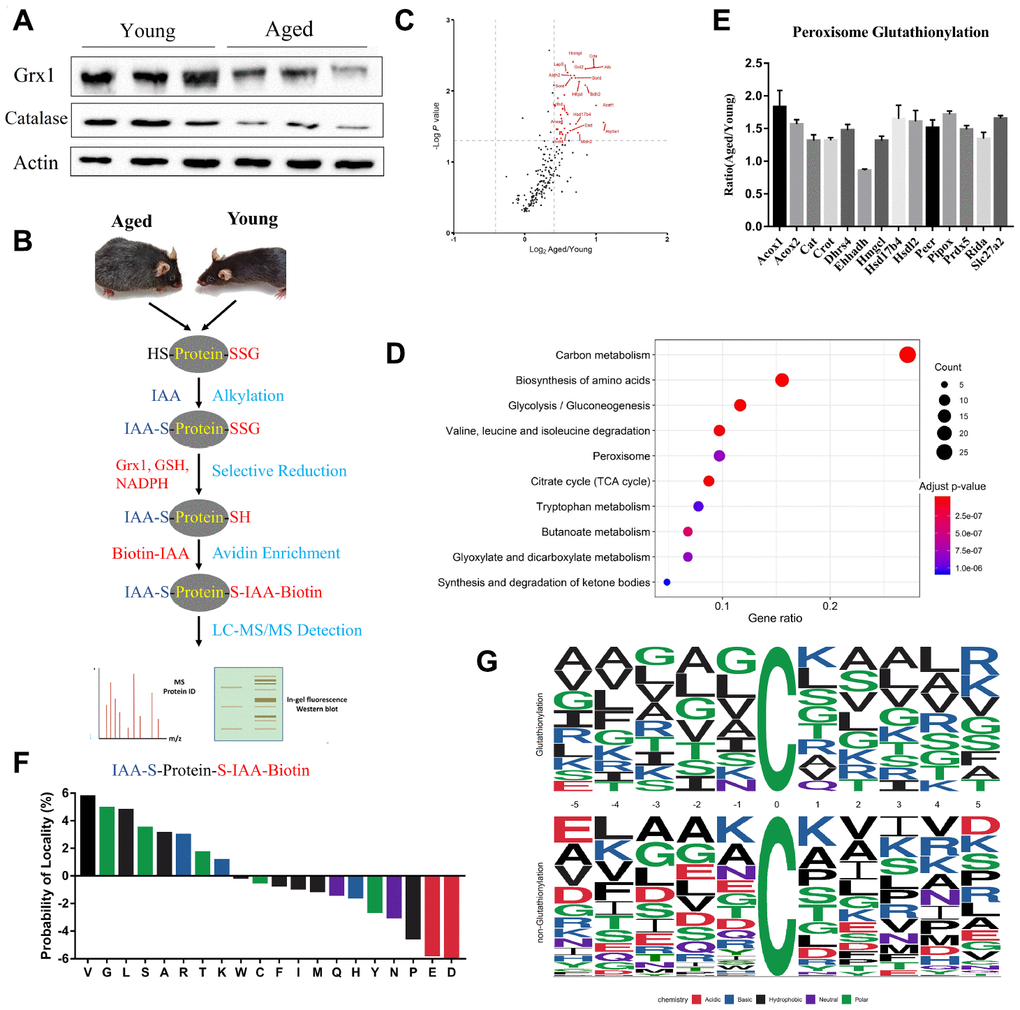
Figure 3.Profiling protein glutathionylation in young and aged mouse kidneys. (A) Western blot analysis of Glrx1 and catalase in kidney tissues. (B) Workflow of profiling cysteine glutathionylation. (C) Volcano plot of glutathionylated proteins in young and aged kidneys; glutathionylated peroxisomal proteins are red-coded. (D) KEGG enrichment analysis of glutathionylated proteins. (E) Histogram of the increased glutathionylation of peroxisomal proteins. (F) Significant enrichment of small amino acids, lysine and arginine against aspartic acid and glutamic acid at the proximal position (±five positions) to glutathionylated cysteine residues. (G) Consensus motif for glutathionylated cysteine residues shows significant enrichment of lysine and arginine across a range of proximal positions. Error bars represent ± SEM.