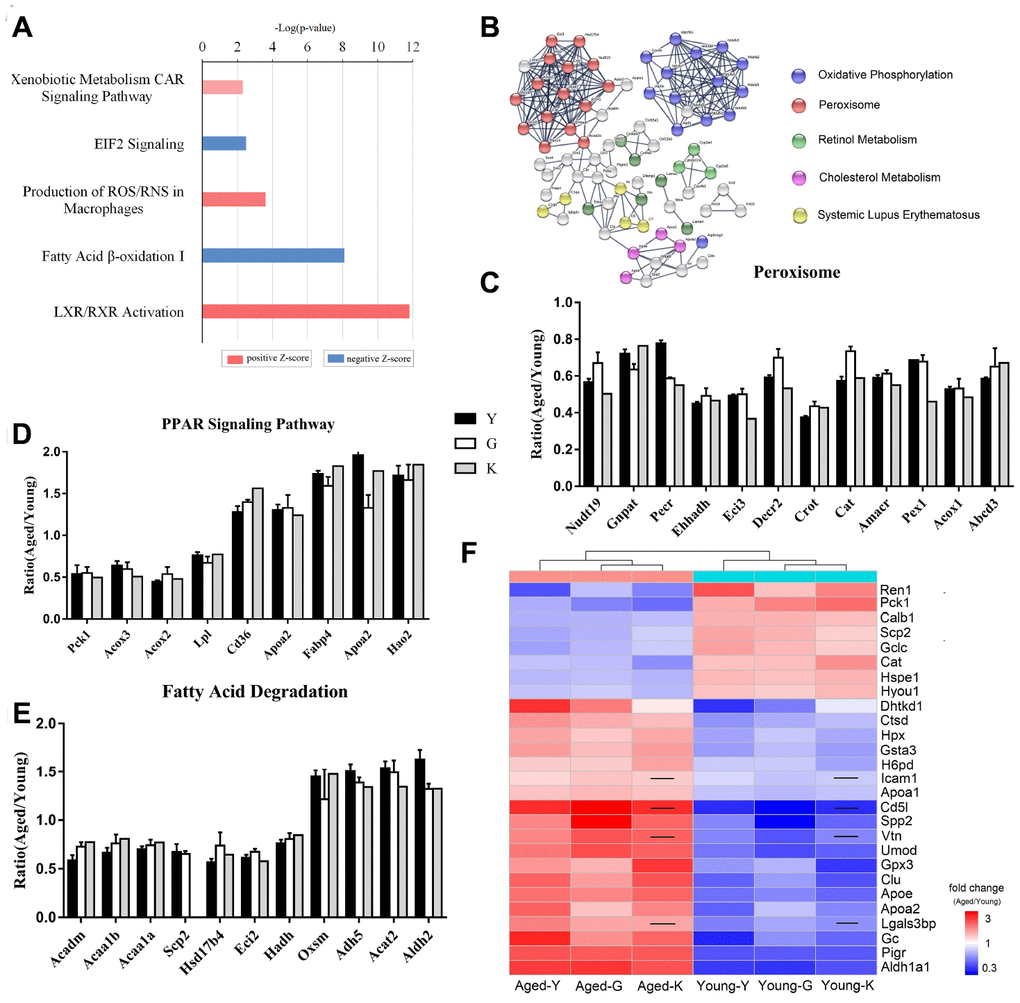
Figure 2.Biomarkers for renal aging. (A) Ingenuity Pathway Analysis (IPA) of DEPs in aged and young mouse kidneys analyzed by proteomics. (B) STRING network analysis based on robust Spearman correlation for DEPs in aged and young mouse kidneys. (C–E) Histogram of peroxisomal proteins (C), proteins associated with PPAR signaling (D), and proteins associated with fatty acid degradation pathway (E). (F) A heat-map showing biomarkers for renal aging; the black line indicates that the corresponding protein was not present in K-dataset. Error bars represent ± SEM.