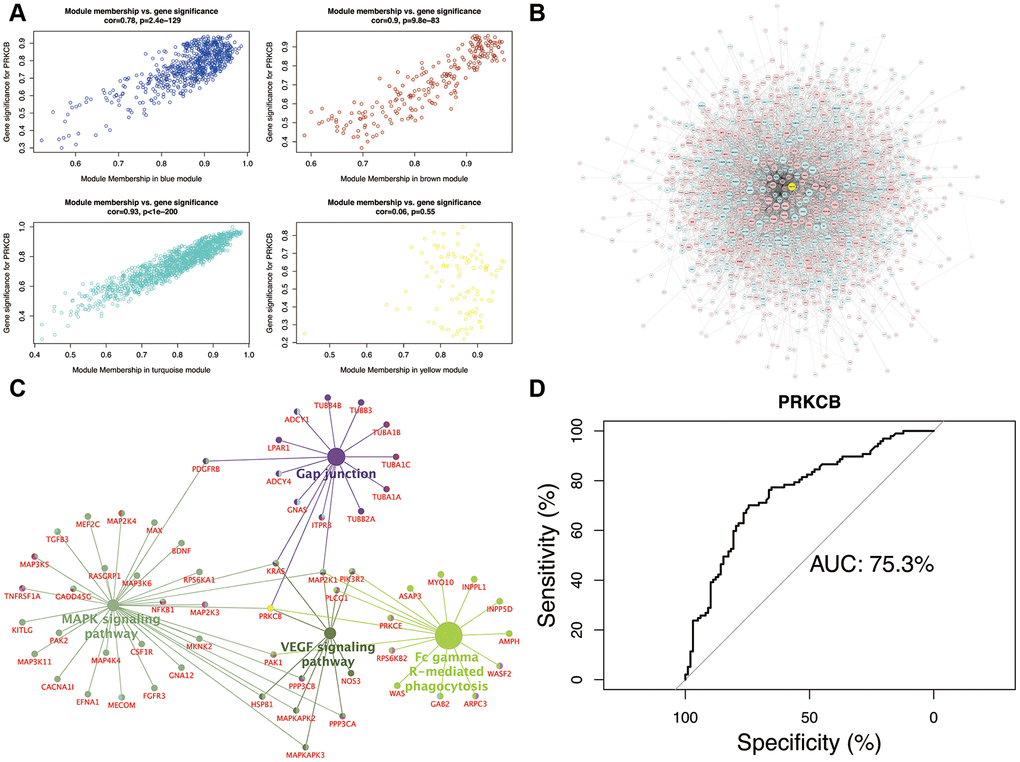
Figure 4.Module-pathway regulatory network and AUC analysis. Scatterplot of module membership vs. gene significance (A) Global regulatory network of turquoise module (B) node size represents the degree of gene connectivity; yellow and blue indicate low expression of gene, whilst red represents high expression. The intersection pathways of PRKCB (C) yellow indicates the low PRKCB expression. Performance evaluation of AUC analysis (D) AUC: area under the curve.