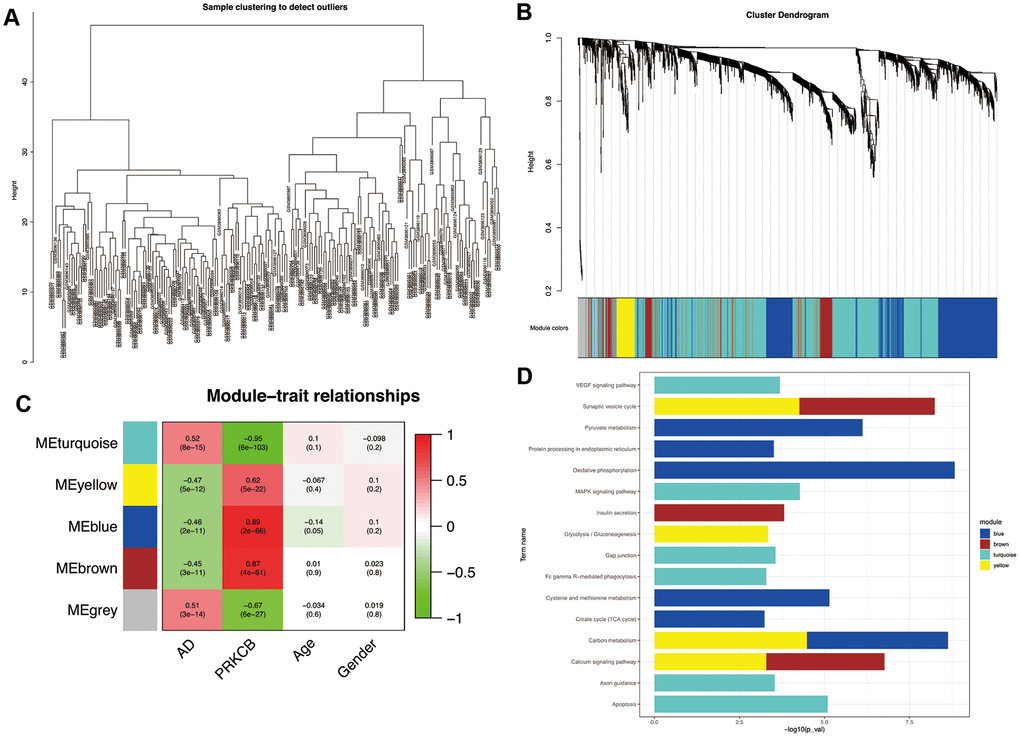
Figure 3.Weighted correlation network analysis. All the samples were included in the clusters (A) Cluster dendrogram of five modules with different colors (B) grey represents non-clustering genes. The heatmap of module-trait relationships (C) red indicates positive correlation and green represents negative correlation. Enrichment analysis of KEGG pathways in co-expression modules (D) AD: Alzheimer’s disease, KEGG: Kyoto Encyclopedia of Genes and Genomes.