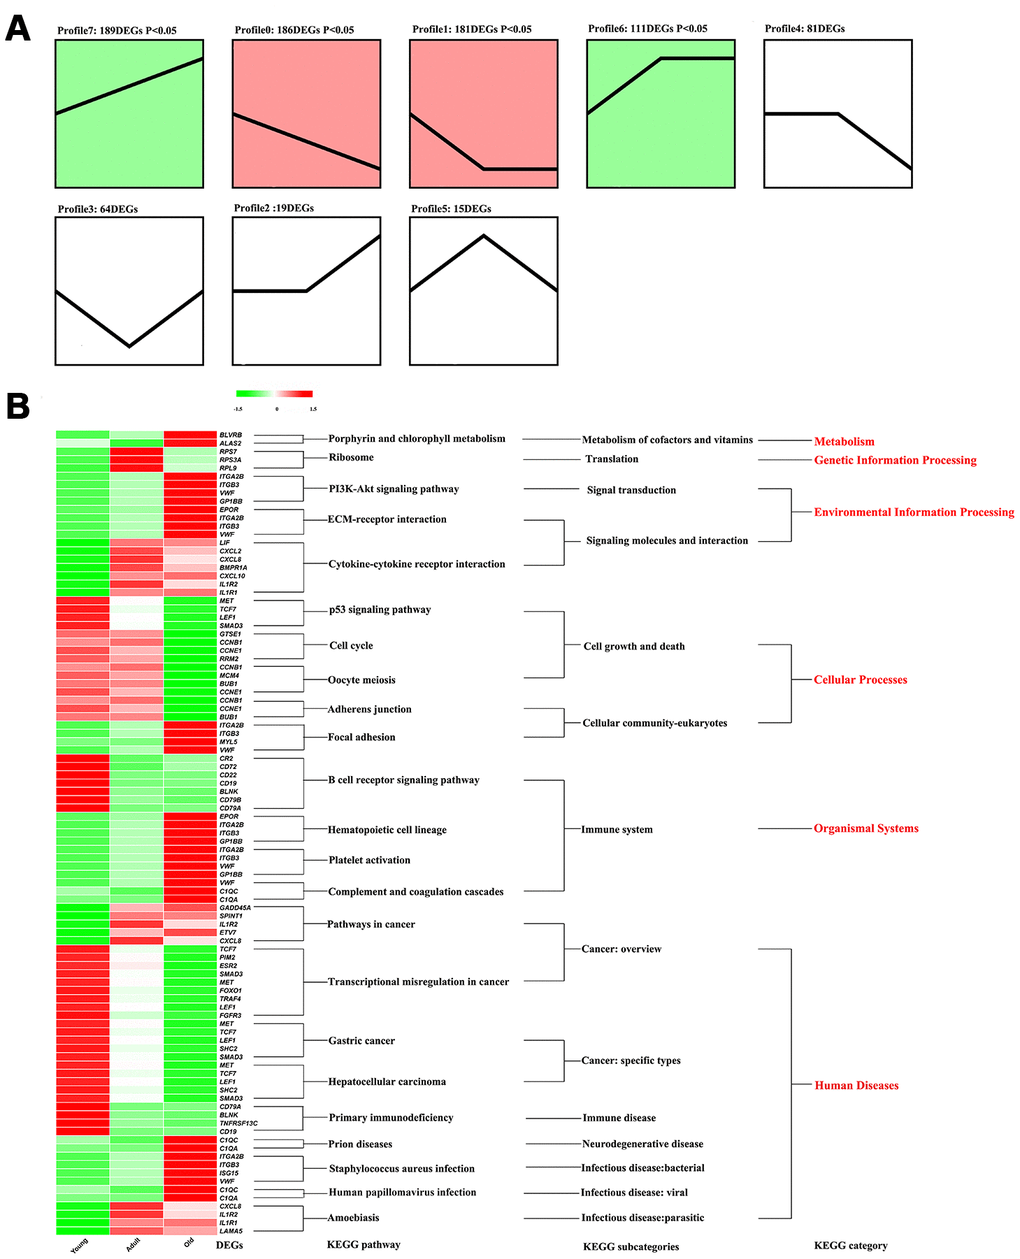
Figure 3.The functional analysis of DEGs. (A) Identify different profile through STEM. Trend blocks with color: Trends with significant enrichment, trend blocks with similar trends have the same color. Trend blocks without color: Trends with no significant enrichment. (B) KEGG pathways significantly enriched by DEGs in each profile.