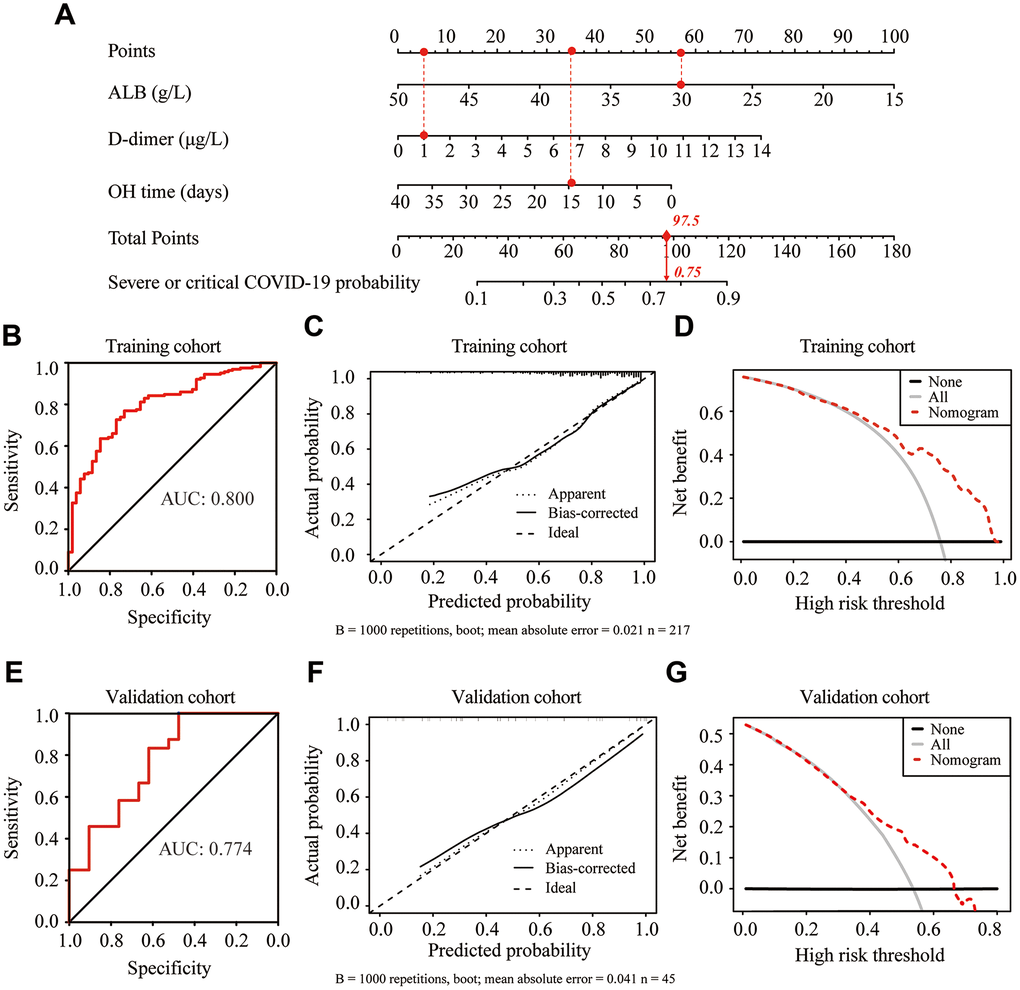
Figure 3.Construction and validation of the predictive nomogram for the severity of COVID-19 in elderly patients. (A) Development of the nomogram to predict the severity of COVID-19 in elderly patients. For example, if the albumin (ALB), d-dimer and onset to hospitalization (OH) time of an admitted elderly COVID-19 patient were 30 g/L, 1 μg/L and 15 days, respectively, the corresponding points for ALB, d-dimer and OH time were 57.5, 5 and 35, respectively. The total points value for this patient was 97.5, with a probability of 0.75 for developing severe or critical illness after admission. (B, E) Receiver operating characteristic (ROC) curves of the nomogram in the training cohort (B) and validation cohort (E). (C, F) Calibration curve of the nomogram in the training cohort (C) and validation cohort (F). (D, G) Decision curve analysis in the training cohort (D) and validation cohort (G). The y-axis represents net benefits, calculated by subtracting the relative harms (false positives) from the benefits (true positives). The x-axis measures the threshold probability.