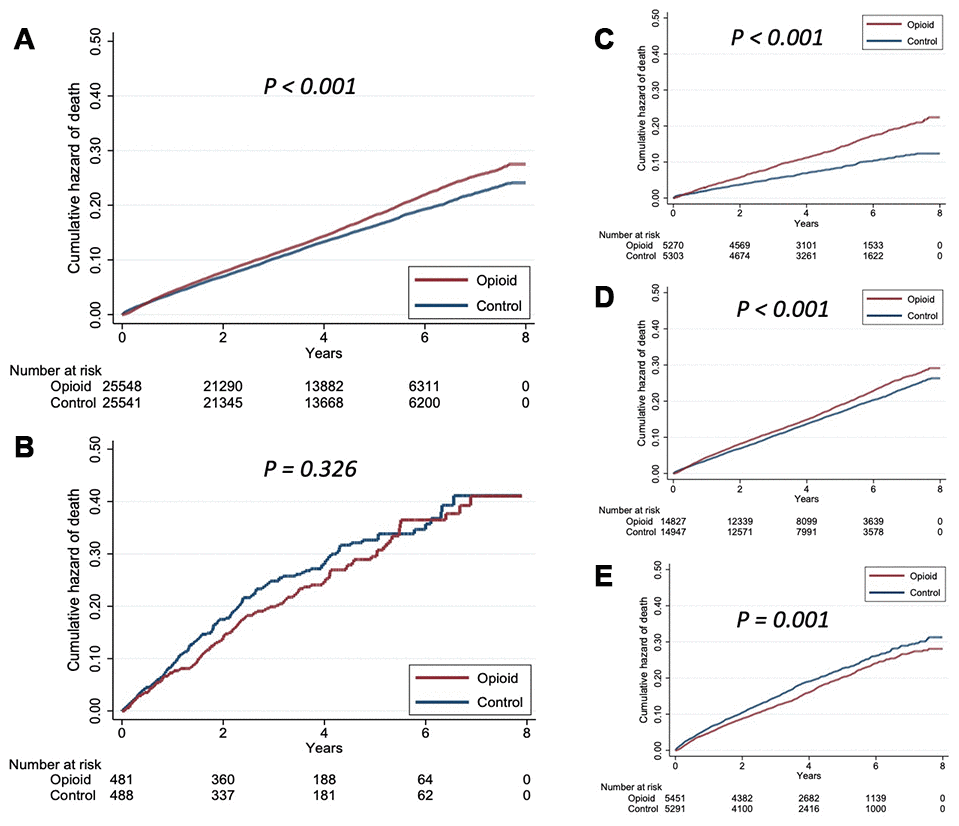
Figure 3.Kaplan-Meier survival curves based on (A) frailty presence; (B) frailty absence; (C) having none of the FRAIL items; (D) having 1 positive FRAIL item; and (E) having 2 positive FRAIL items.
Figure 3 — Frailty modifies the association between opioid use and mortality in chronic kidney disease patients with diabetes: a population-based cohort study | Aging