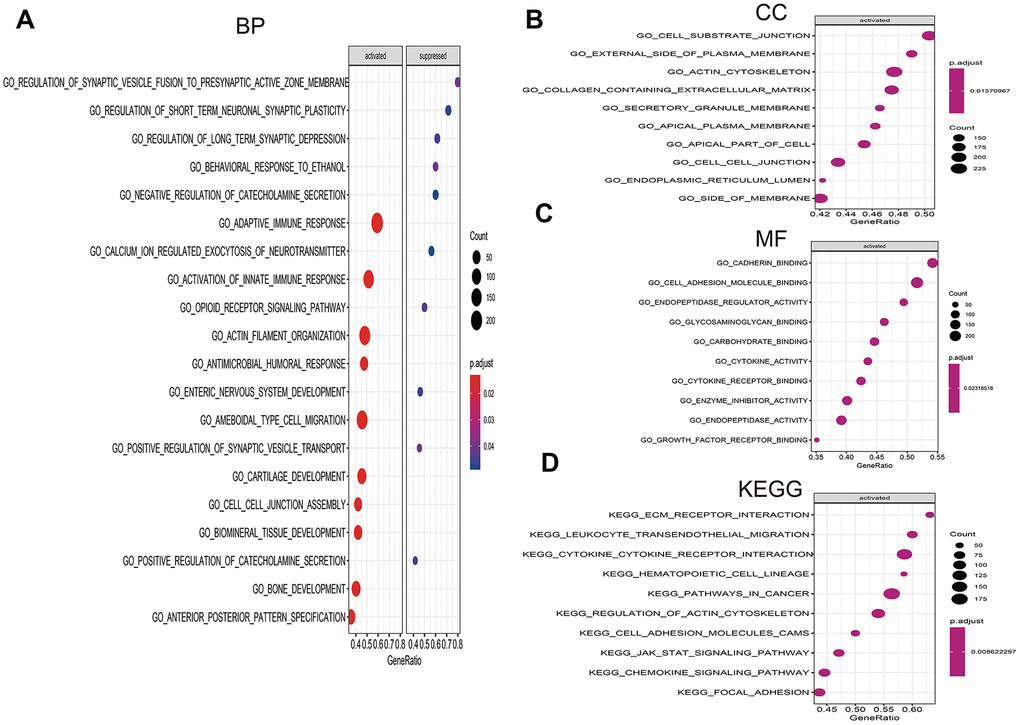
Figure 9.Gene set enrichment analysis (GSEA) of high- vs. low-risk scores groups in TCGA. (A) The top 10 activated pathways in biology process (BP). (B) The top 10 activated pathways in cellular component (CC). (C) The top 10 activated pathways in molecular function (MF). (D) The top 10 activated pathways in Kyoto Encyclopedia of Genes and Genomes (KEGG).