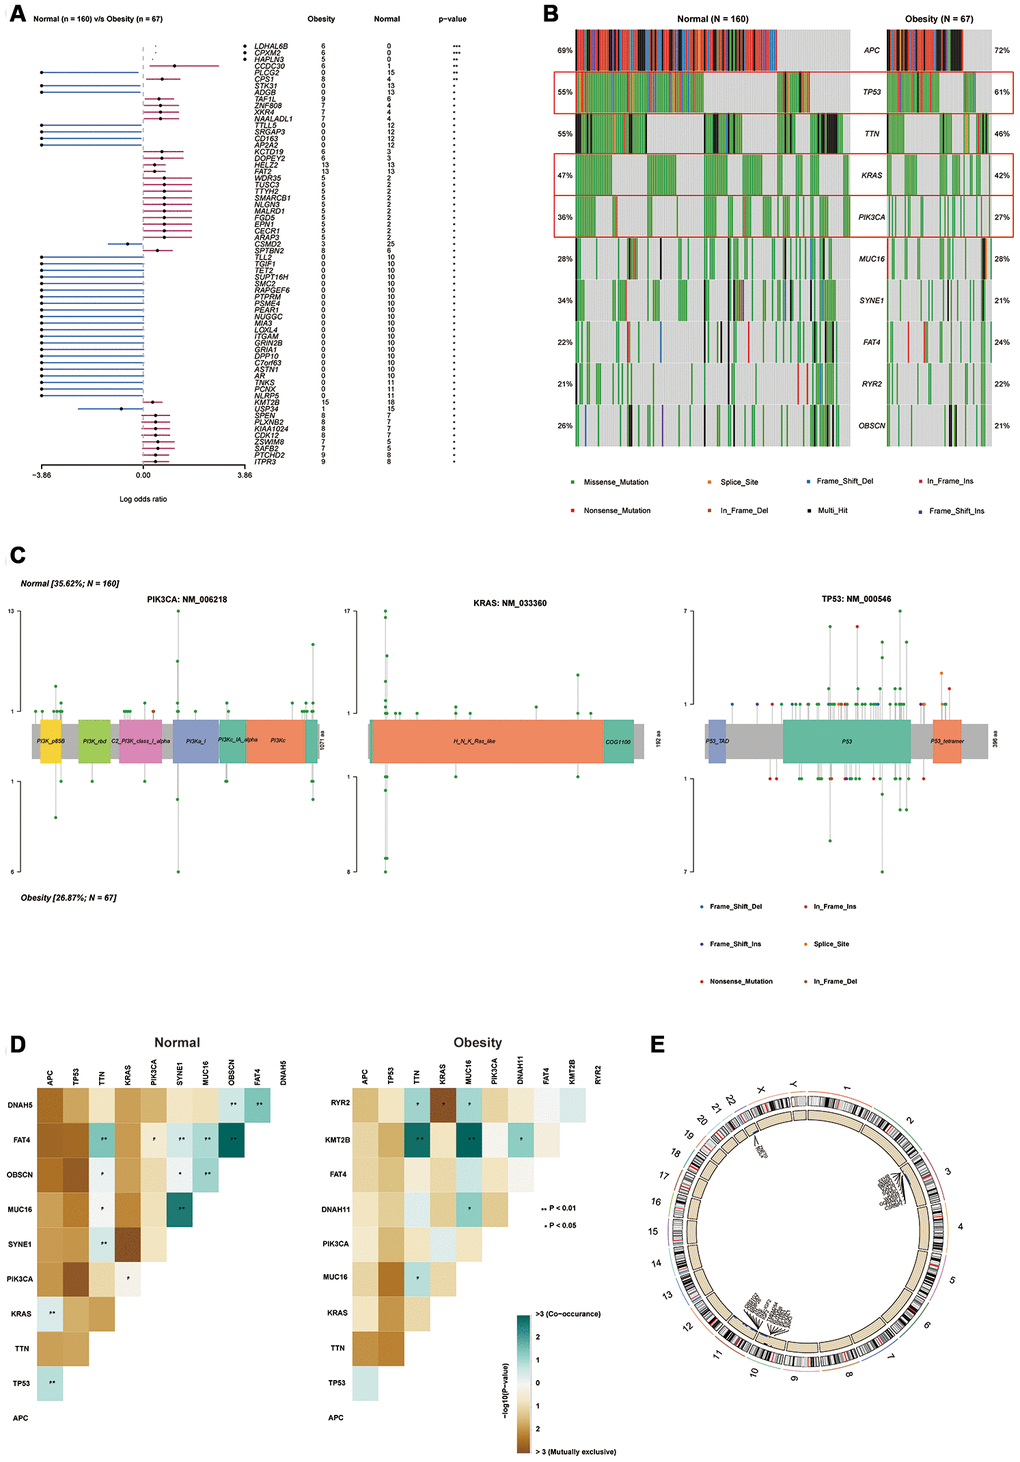
Figure 4.Obesity was associated with the alteration of gene mutations. (A) Forest plot for different mutations frequency compared between normal and obesity groups, analyzed by Chi-square test. (B) Top 10 mutations in normal and obesity groups. (C) “Lollipop” graph for specific mutation frequency, types and sites in PIK3CA, KRAS and TP53 (p53) protein domain. Mutation sites were shown on the x-axis, and the frequency of a particular mutation was represented by the height (y-axis). (D) Interaction of each top 10 mutation in normal and obesity group analyzed by Fisher exact test. (E) The distribution of copy number variation (CNV) in normal and obesity groups analyzed by Chi-square test. (*p<0.05, **p<0.01, ***p<0.001).