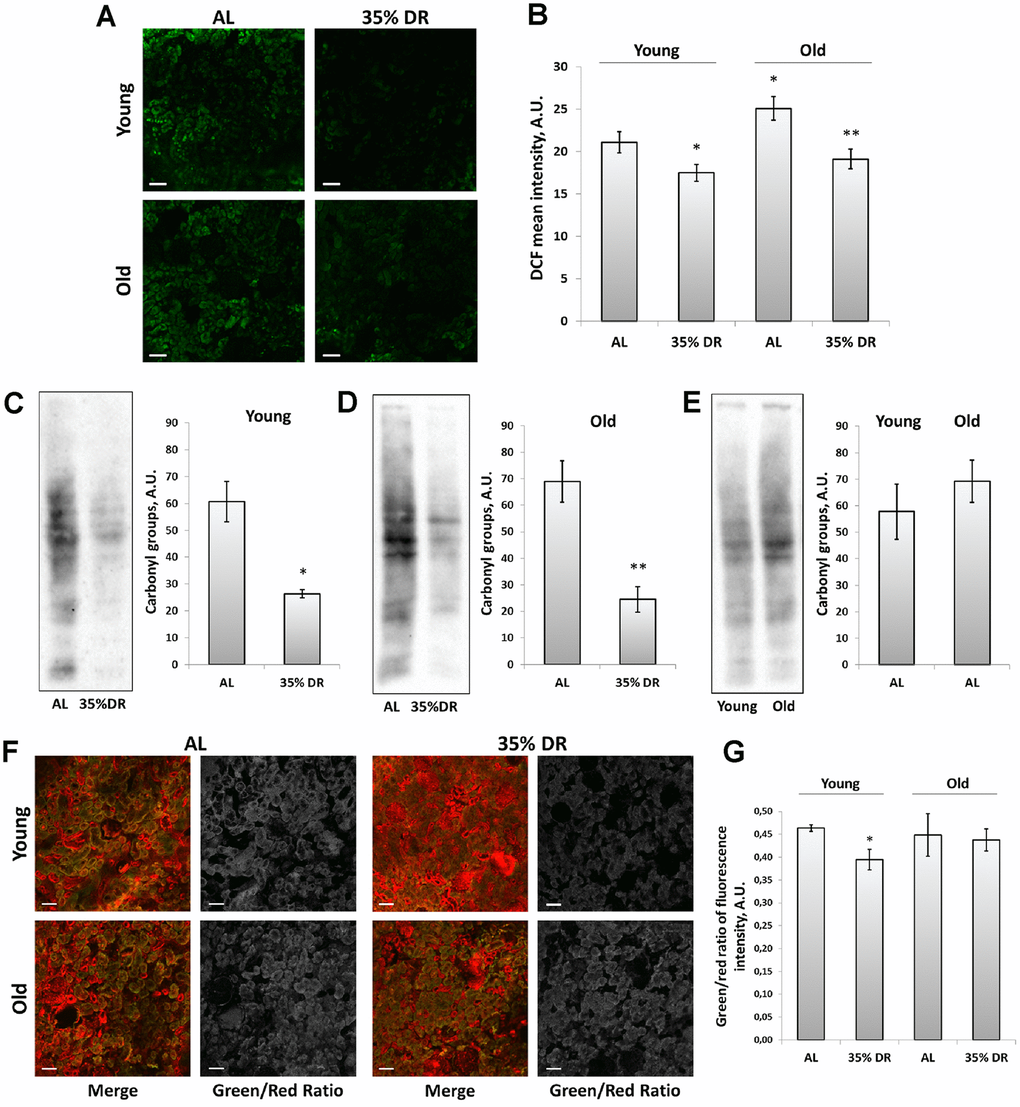
Figure 6.ROS production and oxidative stress in the kidney. (A) Confocal microscopy of DCF-loaded vital kidney slices. Scale bar, 100 μm; (B) Quantification of DCF fluorescence intensity on confocal images; (C) OxyBlot staining for carbonylated proteins in kidney tissue of young DR rats; (D) OxyBlot staining for carbonylated proteins in kidney tissue of old rats after DR; (E) Comparison of carbonylated protein levels in kidney tissue of young and old rats; (F) Confocal microscopy of vital kidney slices stained with Lipid Peroxidation Kit. Scale bar, 100 μm; (G) Estimation of lipid peroxidation measured by a green/red ratio of fluorescence intensity. *p < 0.05 compared to young AL-group, *p < 0.05 compared to old AL-group. For young AL rats n=5, for young DR rats n=6, for old AL rats n=6, for old DR rats n=5. AL, ad libitum, DR, dietary restriction.