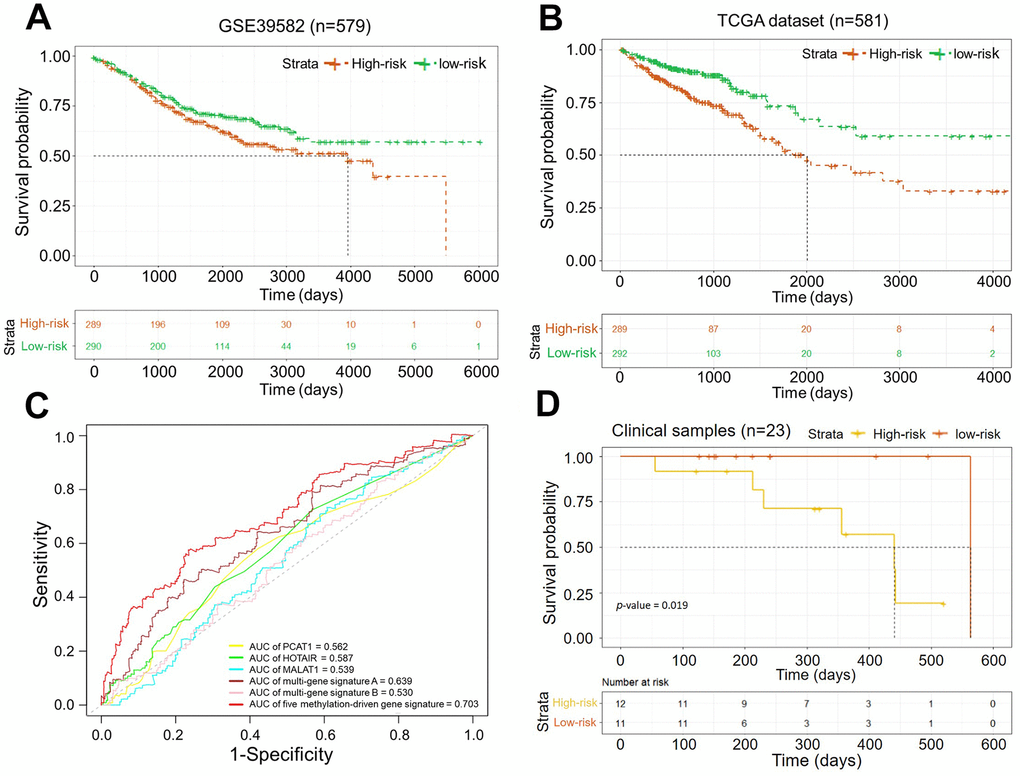
Figure 6.(A) Kaplan–Meier curves of the OS in dataset GSE39582 (p-value < 0.05); (B) Kaplan–Meier curves of the OS in the dataset from TCGA (p-value = 0.0001); (C) ROC curves of five methylation-driven gene signature and other known biomarkers for prognosis in CRCs. (D) Kaplan–Meier curves of the OS in clinical samples (p-value = 0.019).