Submit an Article
Navigate
Home
Editorial Board
Editorial Policies
Current Volume
Archive
Scientific Integrity
Publication Ethics Statements
Interviews with Outstanding Authors
Newsroom
Sponsored Conferences
Podcast
Contact
Special Collections
Submit an Article
Online ISSN: 1945-4589
Research Paper
|
Volume 12, Issue 20
|
pp. 20611–20622
Repetitive transcranial magnetic stimulation of the cerebellum improves ataxia and cerebello-fronto plasticity in multiple system atrophy: a randomized, double-blind, sham-controlled and TMS-EEG study
Back to article
Figure 5
(5 of 7)
−
100%
+
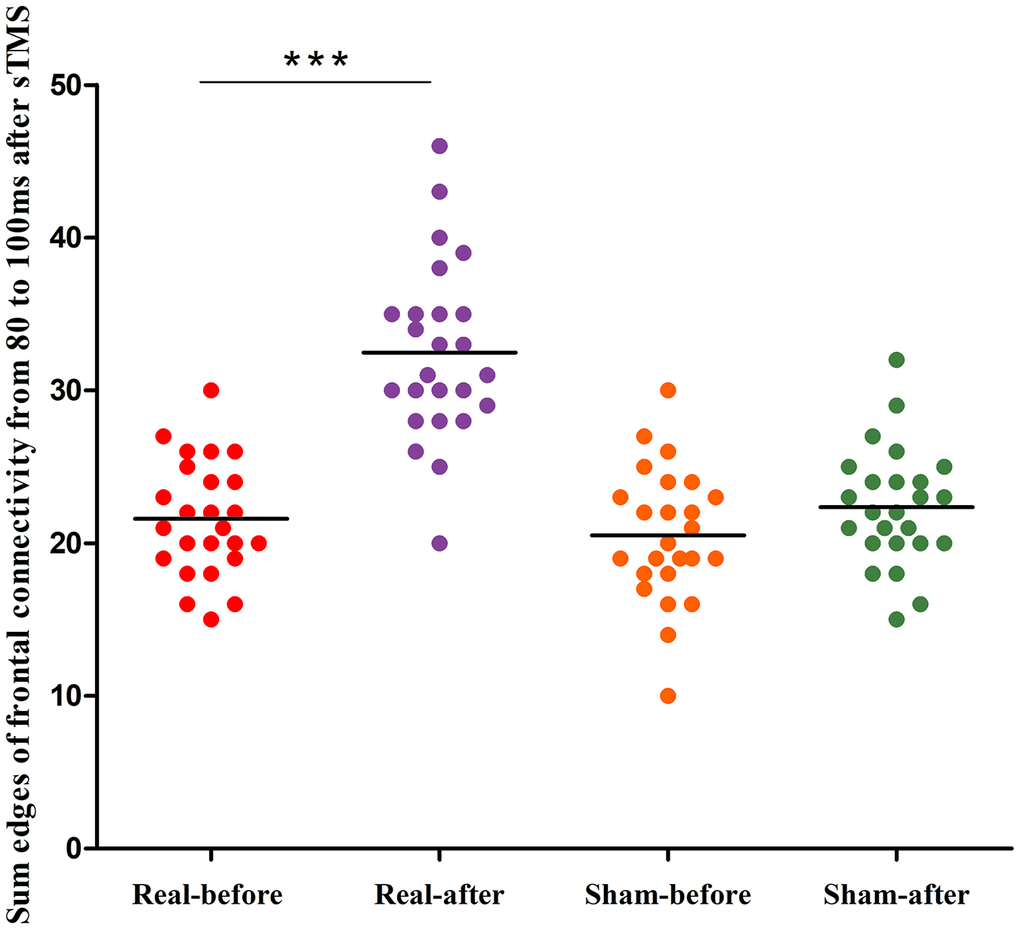
Figure 5.
Differences in the edges of frontal connectivity from 80 to 100 ms of the pre- and post-treatment in the real rTMS and sham group separately.
***P<0.001. sTMS: single-pulse transcranial magnetic stimulation.