Aging
Navigate
Back to articleFigure 3(3 of 7)
100%
Figure 3
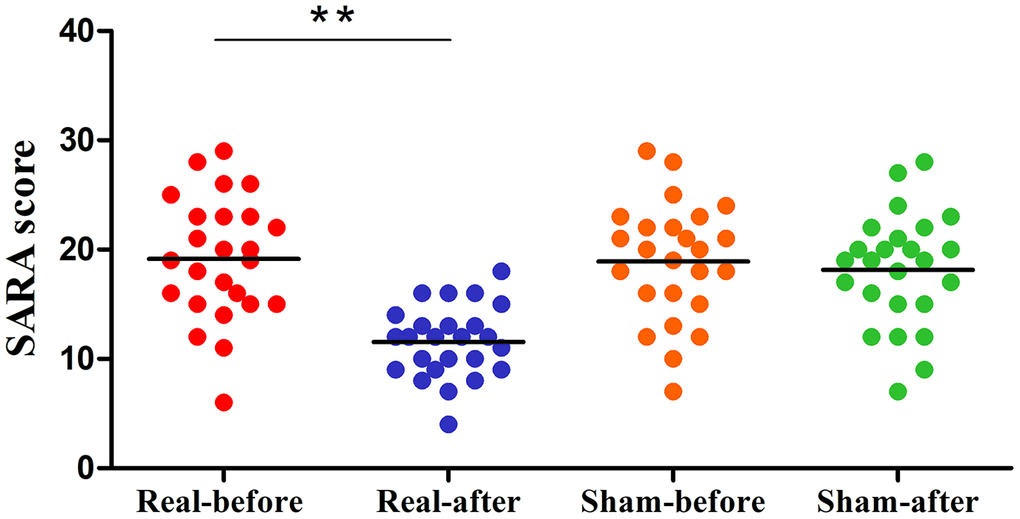
Figure 3.Differences in SARA scores of the pre- and post-treatment in the real rTMS and sham group separately. The real rTMS group exhibits decreases in SARA scores after treatment compared with the sham rTMS group. **P<0.01. SARA: scale for the assessment and rating of ataxia.
Figure 3 — Repetitive transcranial magnetic stimulation of the cerebellum improves ataxia and cerebello-fronto plasticity in multiple system atrophy: a randomized, double-blind, sham-controlled and TMS-EEG study | Aging