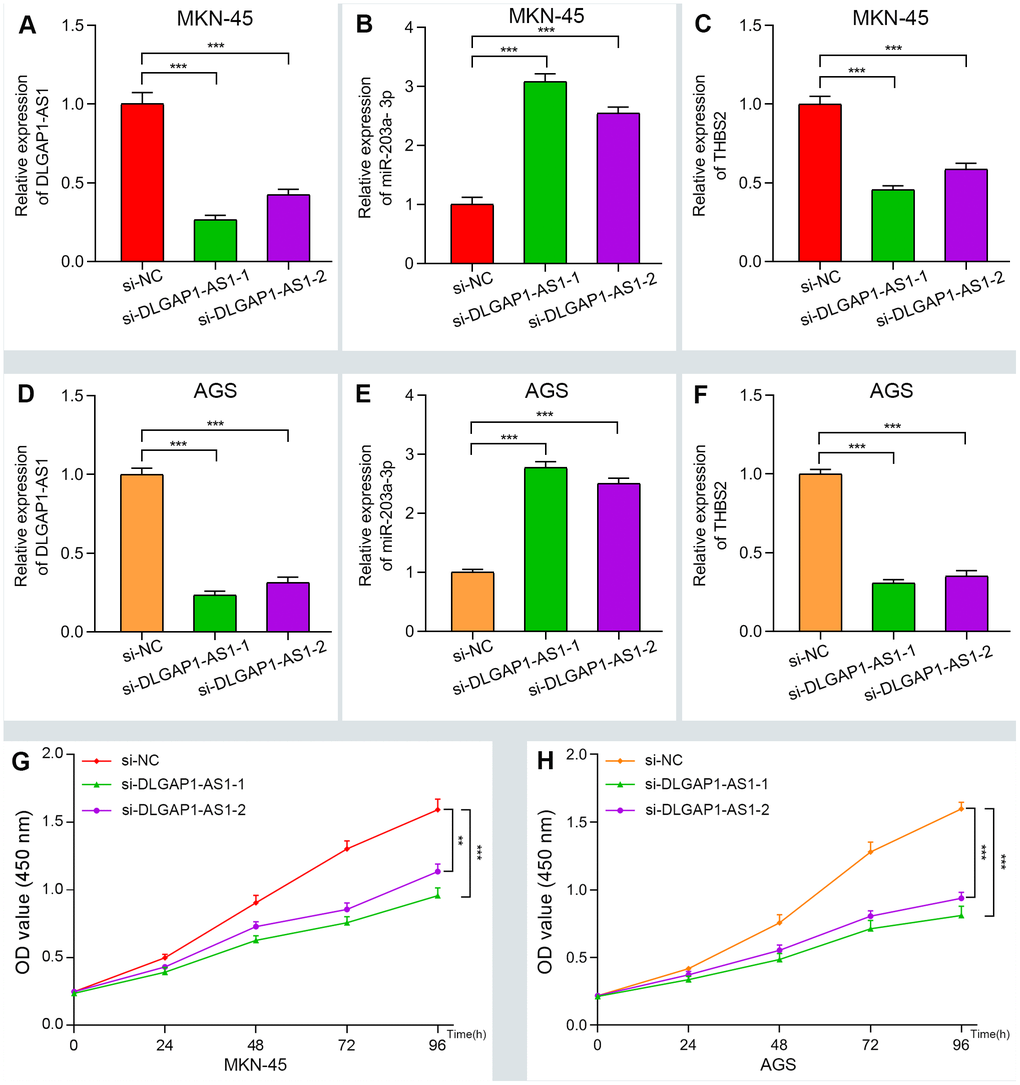
Figure 5.Verifying the ceRNA network through knockdown and CCK-8 assay. (A–F) The relative expression of DLGAP1-AS1 and THBS2 were significantly reduced after silencing DLGAP1-AS1, whereas the relative expression of miR-203a-3p was significantly increased in MKN-45 and AGC cell lines. (G–H) DLGAP1-AS1 knockdown efficiently suppressed MKN-45 and AGC cell proliferation, respectively. (*P < 0.05, **P < 0.01, ***P < 0.001)