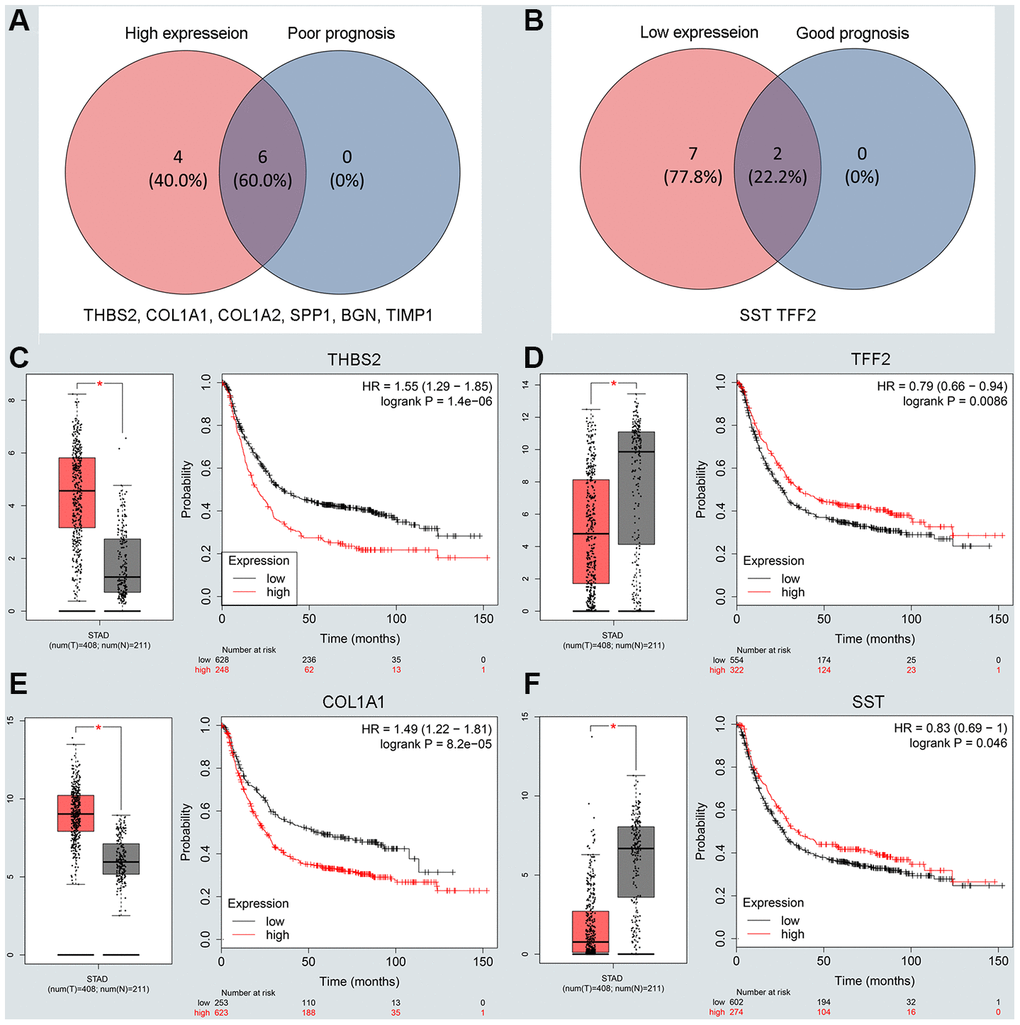
Figure 3.Screening and validating the expression roles and prognosis values of key genes in GC. (A) Screening the key genes with high expression and dismal prognosis values in upregulated hub genes. (B) Screening the key genes with low expression and good prognosis values in downregulated hub genes. (C–F) Validating expression roles and prognosis values of key genes in hub genes using GEPIA and Kaplan–Meier plotter databases.