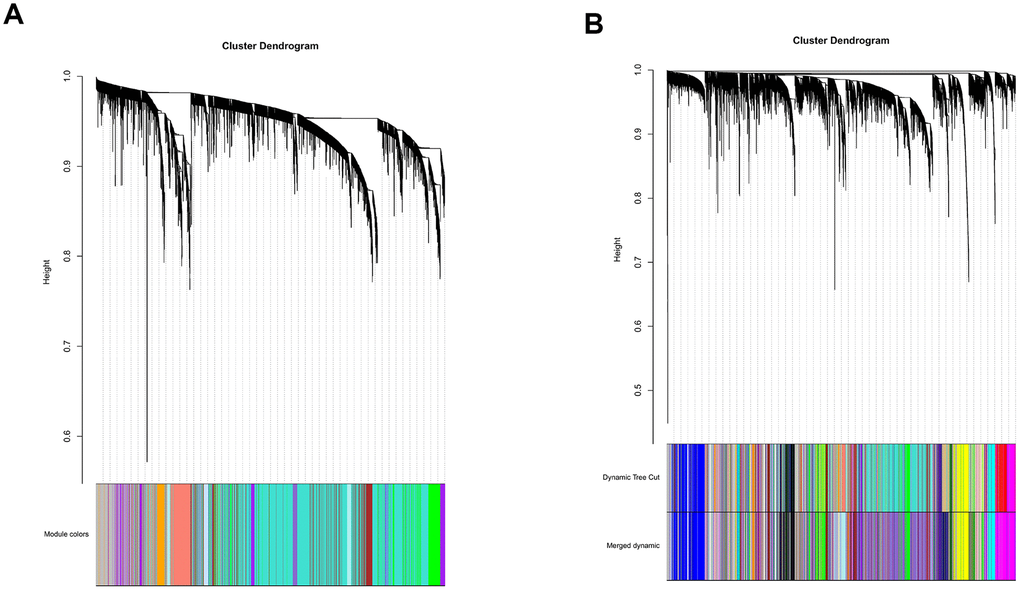
Figure 5.Establishment of co-expression modules of MB. The colored bars below the clustering dendrogram represent the original modules (A) and merged modules (B). Fifty-five modules were generated by the Dynamic Tree Cut method. Forty-one modules were identified after merging according to the module dissection threshold.