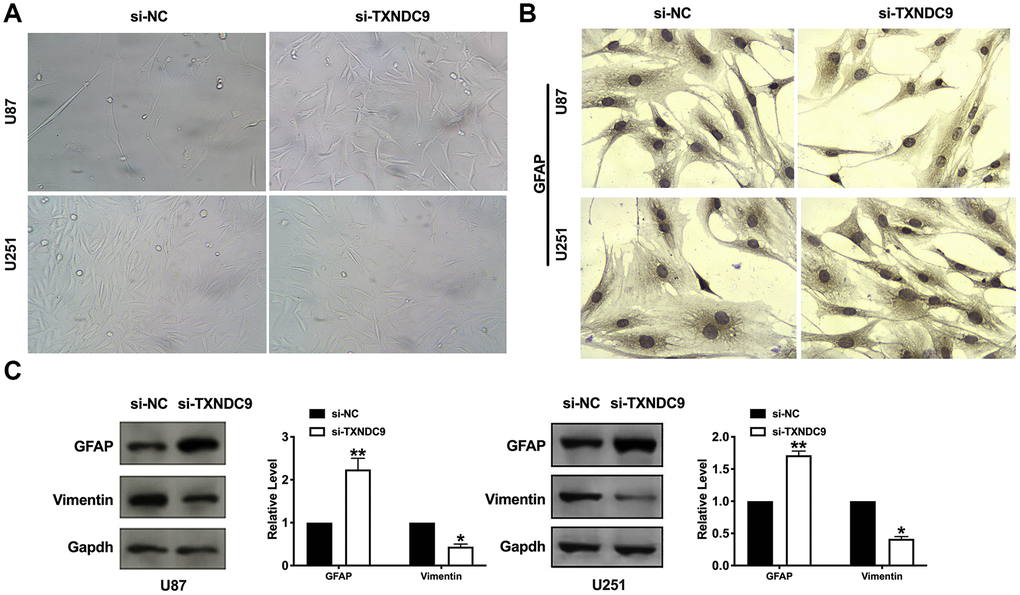
Figure 4.Knockdown of TXNDC9 induced differentiation of glioma cells. (A) U87 cell morphology was scanned after transfecting with si-TXNDC9/si-NC. (B) The immunocytochemical assay was performed for GFAP expression. (C). The protein level of vimentin and GFAP were measured in U87 and U251 cells, Gapdh was indicated as a loading control. n= 6, *P<0.05, **P<0.01.