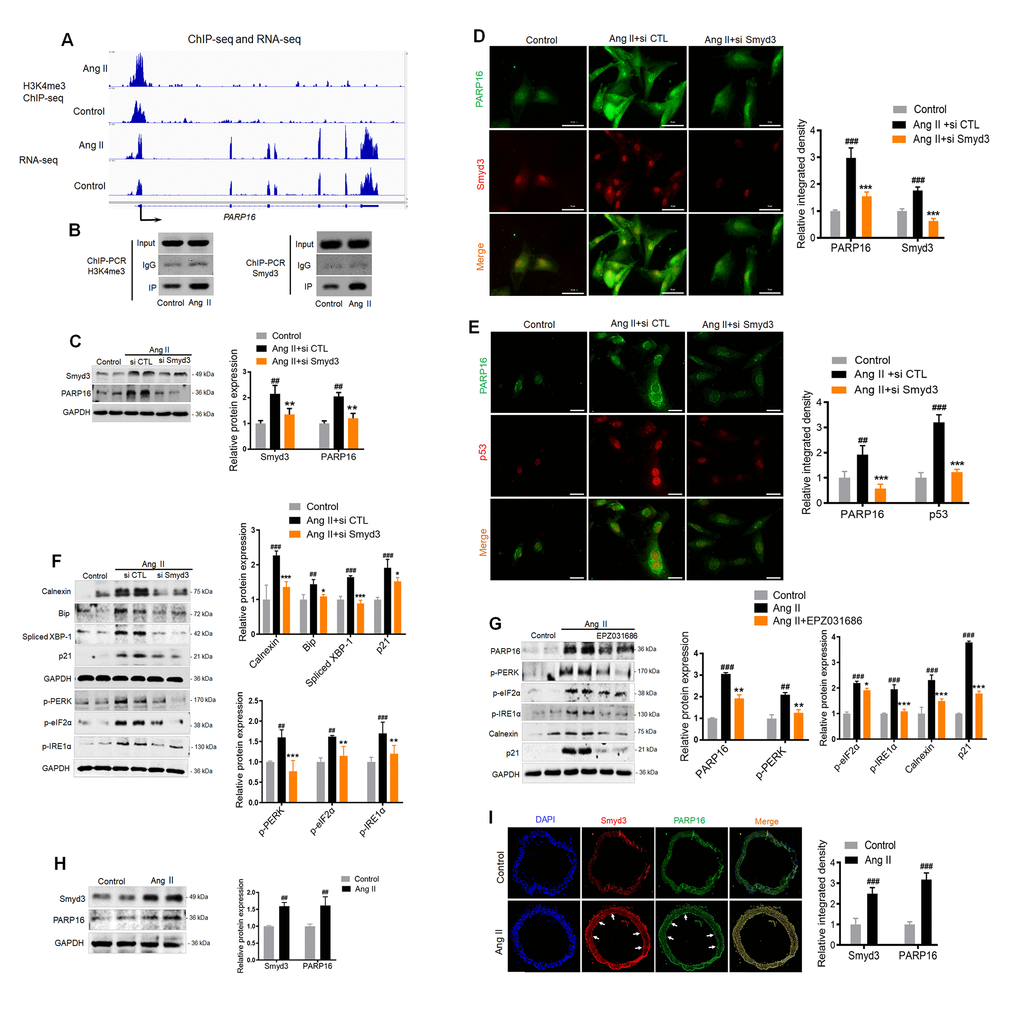
Figure 4.Binding of Smyd3 to both promotors of Parp16 transcript variants leads to increased H3K4me3 level and elevated gene expression. (A) Integrative Genomics Viewer (IGV) showed signal of ChIP-seq (H3K4me3) and RNA-seq at PARP16 coding gene’s locus in control and Ang II-induced (Ang II, 48 h) RAEC cells. The Y axis was normalized to the same scale. Black arrow means primer pairs used for ChIP-PCR in panel B. (B) ChIP-PCR using either H3K4me3, Smyd3 or IgG antibody was carried out in control and Ang II-induced RAECs. (C–F) Knockdown of Smyd3 inhibited Ang II-induced PARP16 expression and ER stress. PARP16 was assayed by Western blot for RAECs transfected with control or Smyd3 siRNA before and after Ang II treatment. GAPDH serves as loading control (C); Immunofluorescence double staining of Smyd3 and PARP16 in Ang II-induced RAECs (D); Immunofluorescence double staining of p53 and PARP16 in Ang II-induced RAECs (E); ER-associated markers (Calnexin, Bip, Spliced XBP-1, p-PERK, p-eIF2α, p-IRE1α and), together with senescence-associated marker p21 were assayed by Western blot for RAEC cells transfected with control or Smyd3 siRNA before and after Ang II induction (F). (G) Smyd3 inhibitor EPZ031686 reversed Ang II-induced PARP16 and RAECs senescence. PARP16, p-PERK, p-eIF2α, p-IRE1α, Calnexin and p21 were assayed by Western blot for Ang II-induced RAEC cells with or without 20 μM EPZ031686. GAPDH serves as internal control. All data were shown as mean ± S.D of at least 4 independent experiments, ##p < 0.01, ###p < 0.001 vs. control; *p < 0.05, **p < 0.01, ***p < 0.001 vs. Ang II+si CTL or Ang II treated cells. (H–I) Smyd3 and PARP16 expression were increased in arteries from control and Ang II-infused mice model. Smyd3 and PARP16 protein expression were assayed by Western blot for aorta from control and Ang II-infused mice (H); Immunofluorescence double staining of PARP16 and Smyd3 of arteries in control and Ang II-infused mice model, the arrowheads indicate the positive endothelial cells staining in the whole blood vessel (I); Data were shown as mean ± S.D, ##p < 0.01, ###p < 0.001 vs. control, n=6/group.