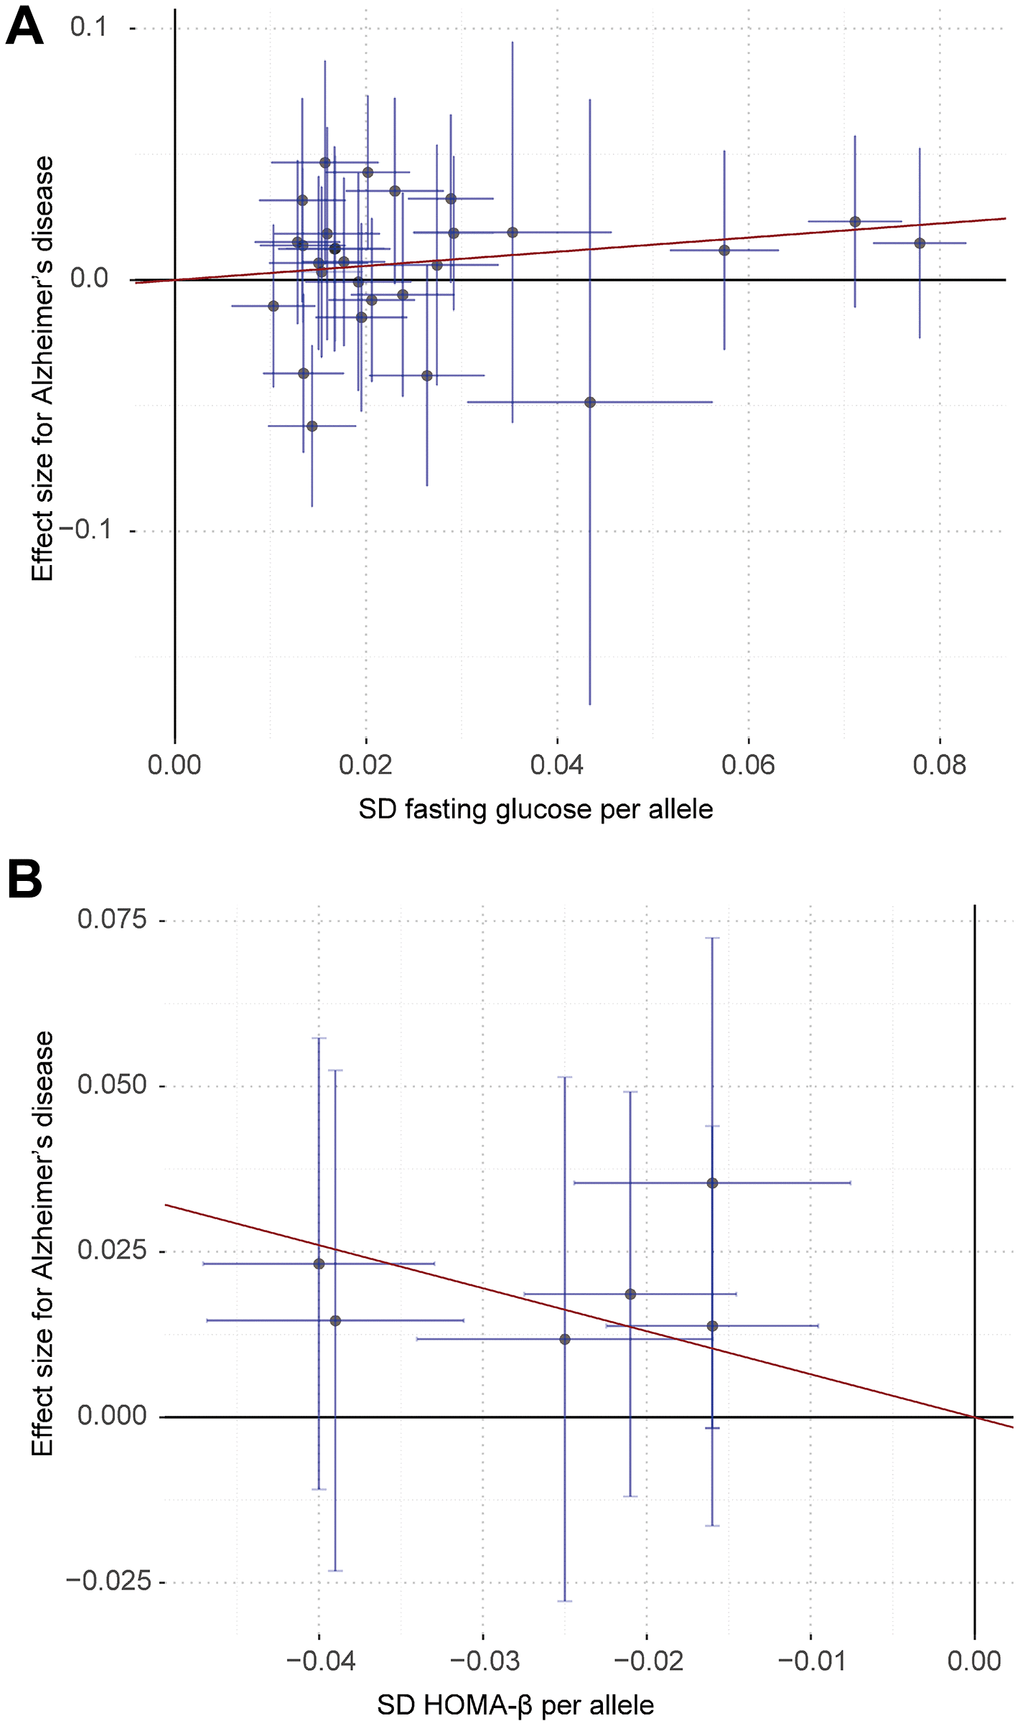
Figure 2.Associations of fasting glucose (A) and HOMA-β (B) related variants with risk of Alzheimer’s disease. The red line indicates the estimate of effect using inverse-variance weighted method. Circles indicate marginal genetic associations between fasting glucose, HOMA-β and risk of Alzheimer’s disease for each variant. Error bars indicate 95% confidence intervals.