Submit an Article
Navigate
Home
Editorial Board
Editorial Policies
Current Volume
Archive
Scientific Integrity
Publication Ethics Statements
Interviews with Outstanding Authors
Newsroom
Sponsored Conferences
Podcast
Contact
Special Collections
Submit an Article
Online ISSN: 1945-4589
Research Paper
|
Volume 12, Issue 21
|
pp. 21391–21403
Aging-related changes in the gene expression profile of human lungs
Back to article
Figure 2
(2 of 2)
−
100%
+
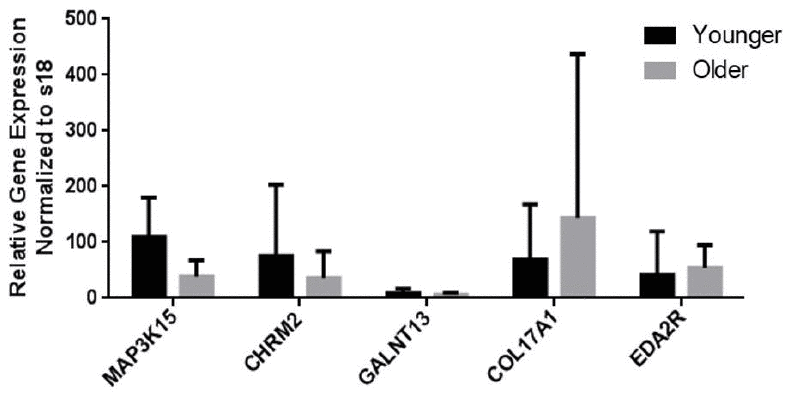
Figure 2.
mRNA expression levels of genes as measured by qRT-PCR analysis.
The levels of mRNA transcripts that encode aging-related marker genes are shown. Data are presented as the mean ± standard deviation (
N
= 32).