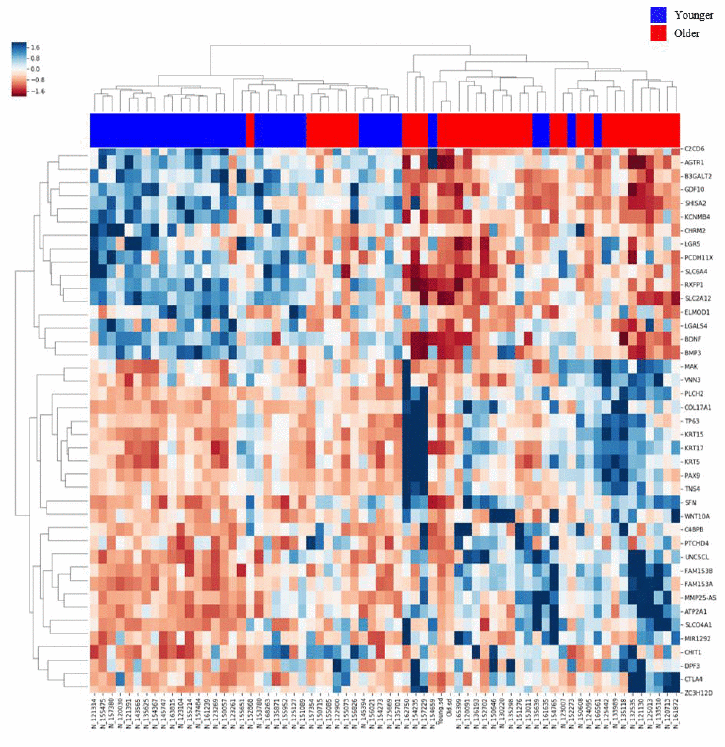
Figure 1.Heatmap of gene expression in the lung tissues of the Older vs. Younger groups. The heatmap of 80 genes with increased or decreased gene expression is illustrated with the hierarchical clustering of gene expression data for the Older and Younger groups. The colored column sidebar at the top indicates the status of the subjects (blue - Younger group; red - Older group). The information has been revised for better flow and readability. Please check if the revised information conveys your intended meaning.