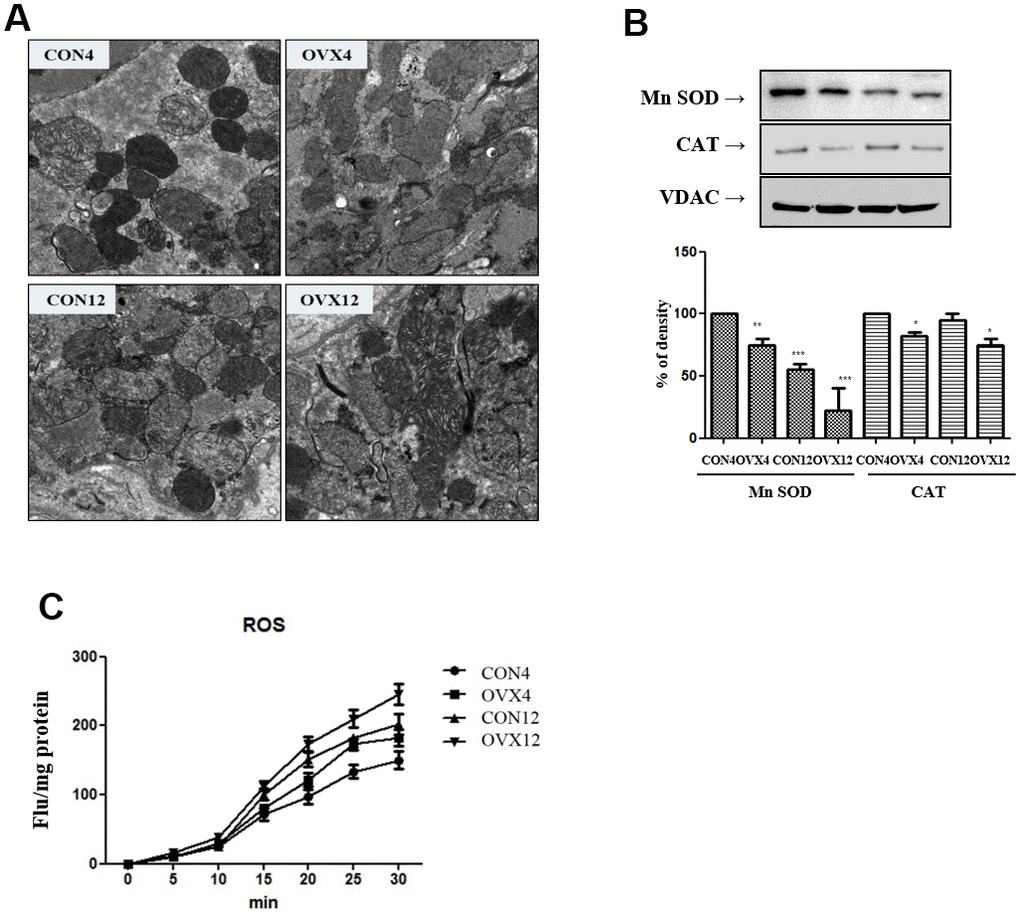
Figure 3.Mitochondria dysfunction. (A) Electron microscopy of submandibular gland in the CON and OVX groups. (B) Western blotting of antioxidant enzyme; SOD and catalase and control VDAC in the CON and OVX groups. (C) ROS generation in the CON and OVX groups. CON = control, OVX = ovariectomy, SOD = superoxide dismutase, CAT = catalase, VDAC = voltage-dependent anion channel.