Submit an Article
Navigate
Home
Editorial Board
Editorial Policies
Current Volume
Archive
Scientific Integrity
Publication Ethics Statements
Interviews with Outstanding Authors
Newsroom
Sponsored Conferences
Podcast
Contact
Special Collections
Submit an Article
Online ISSN: 1945-4589
Research Paper
|
Volume 12, Issue 21
|
pp. 21329–21343
Different polymorphisms in HIF-1α may exhibit different effects on cancer risk in Asians: evidence from nearly forty thousand participants
Back to article
Figure 1
(1 of 5)
−
100%
+
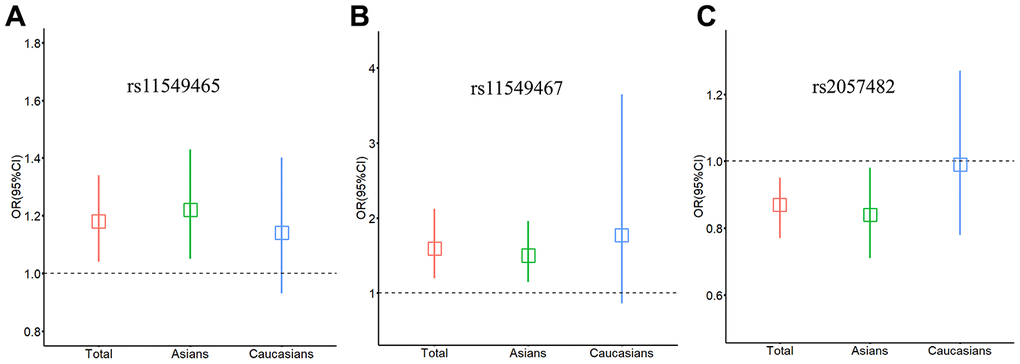
Figure 1.
Relationship between
HIF-1α
SNPs and cancer risk stratified by ethnicity.
(
A
) rs11549465; (
B
) rs11549467; (
C
) rs2057482. Squares represent the ORs and vertical lines represent the corresponding 95% CI.