Submit an Article
Navigate
Home
Editorial Board
Editorial Policies
Current Volume
Archive
Scientific Integrity
Publication Ethics Statements
Interviews with Outstanding Authors
Newsroom
Sponsored Conferences
Podcast
Contact
Special Collections
Submit an Article
Online ISSN: 1945-4589
Research Paper
|
Volume 12, Issue 20
|
pp. 20471–20482
Development of a susceptibility gene based novel predictive model for the diagnosis of ulcerative colitis using random forest and artificial neural network
Back to article
Figure 3
(3 of 9)
−
100%
+
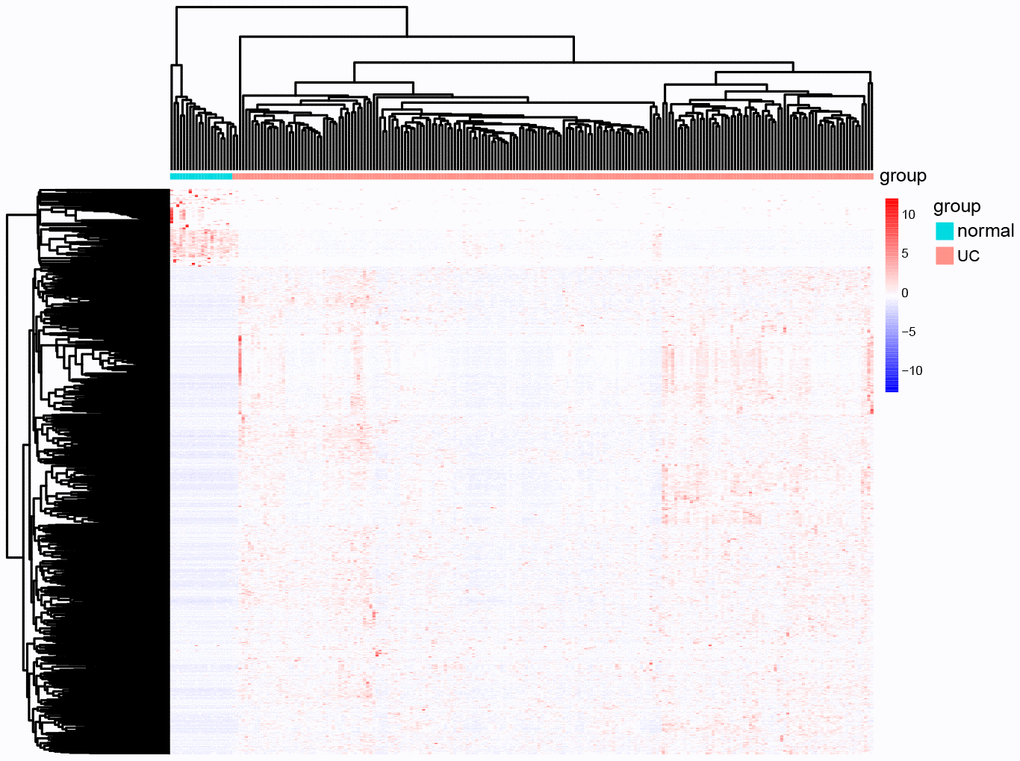
Figure 3.
The heat map of all the DEGs in GSE109142.
In the map, each list represents a gene and up-regulated genes and down-regulated genes also have a clear demarcation. Green/pink columns represents controls/cases (normal people/ UC patients).