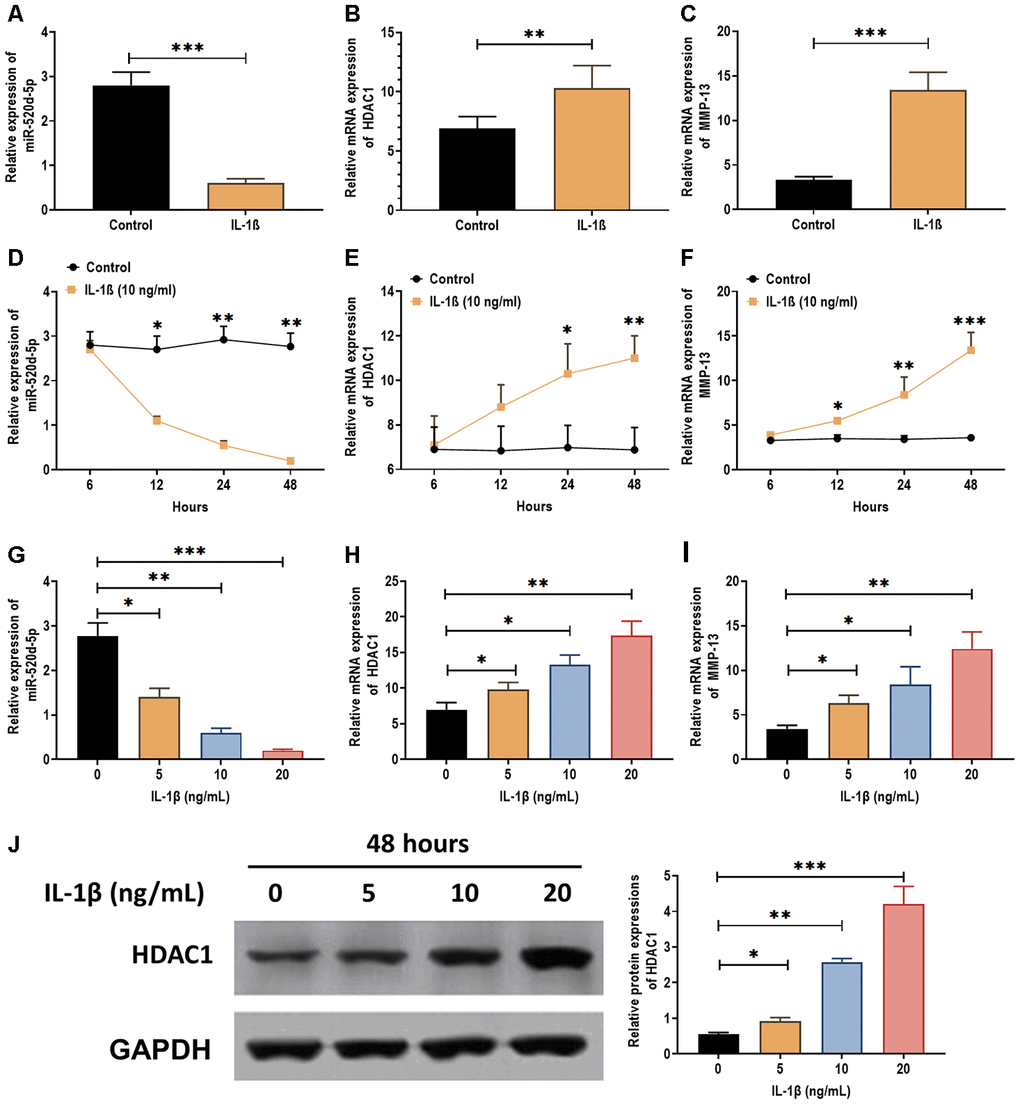
Figure 3.Expressions of miR-520d-5p and HDAC1 in IL-1β-treated PHCs. (A–C) Expressions of miR-520d-5p, HDAC1, and MMP-13 in IL-1β-treated PHCs at 24 hours post-IL-1β treatment (5 ng/mL), respectively. (D–F) Expressions of miR-520d-5p, HDAC1, and MMP-13 in IL-1β-treated PHCs at 6, 12, 24, and 48 hours post-IL-1β treatment (10 ng/mL), respectively. (G–I) Expressions of miR-520d-5p, HDAC1, and MMP-13 in PHCs treated with 0, 5, 10, 20 ng/mL IL-1β at 24 hours post-treatment, respectively. (J) Protein expression of HDAC1 in PHCs treated with 0, 5, 10, 20 ng/mL IL-1β at 48 hours post-treatment. For each experiment, at least three replicates were available for the analysis. Data were expressed as mean ±standard deviation (SD). *P < 0.05; ** P < 0.01; *** P < 0.001.