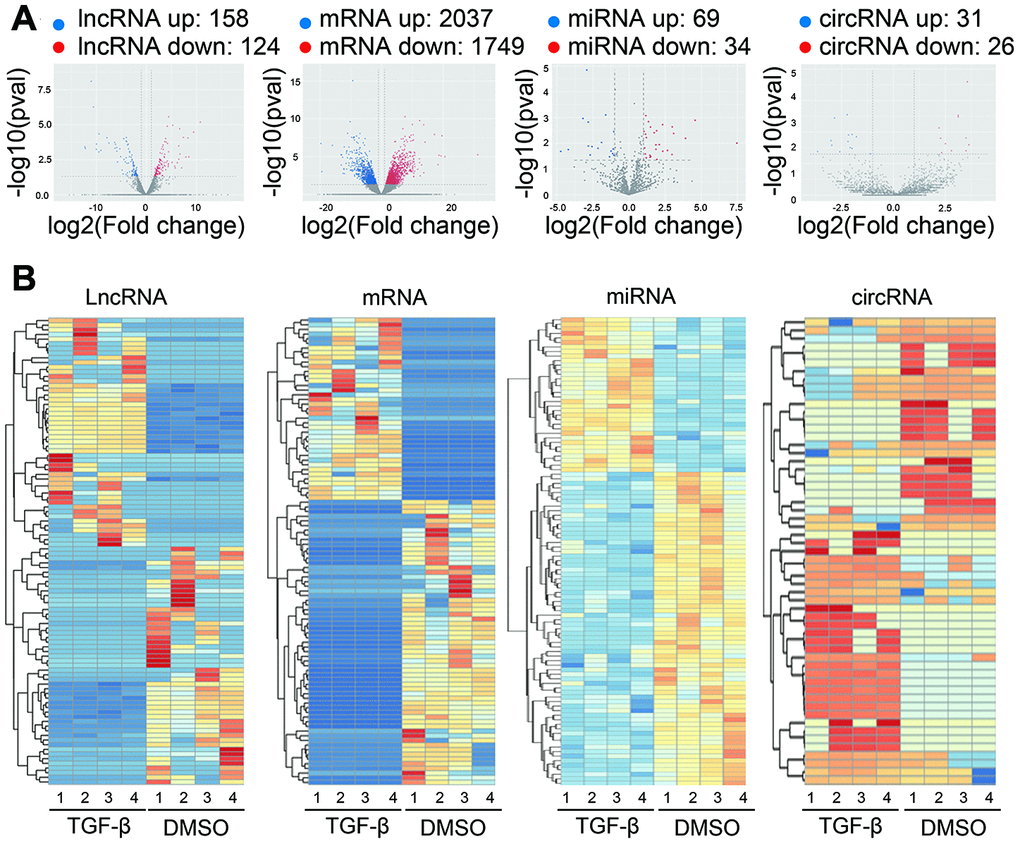
Figure 2.Expression profiles of differentially expressed RNAs. (A) Volcano plot showing differentially expressed lncRNAs, mRNAs, miRNAs and circRNAs with various p-values and fold changes. x axis: log2 ratio of RNA expression levels between treated and untreated Huh7 cells. y axis: false discovery rates (-log10 transformed) of different RNAs. Red points, upregulated RNAs; blue points, downregulated RNAs. (B) Hierarchical clustering analysis based on the significantly differentially expressed lncRNAs, mRNAs, miRNAs, and circRNAs, respectively (Fold Change > 2 and P-Value < 0.05). Red, high relative expression; blue, low relative expression; white, no change in gene expression. Color brightness reflects the degree of expression increase or decrease.