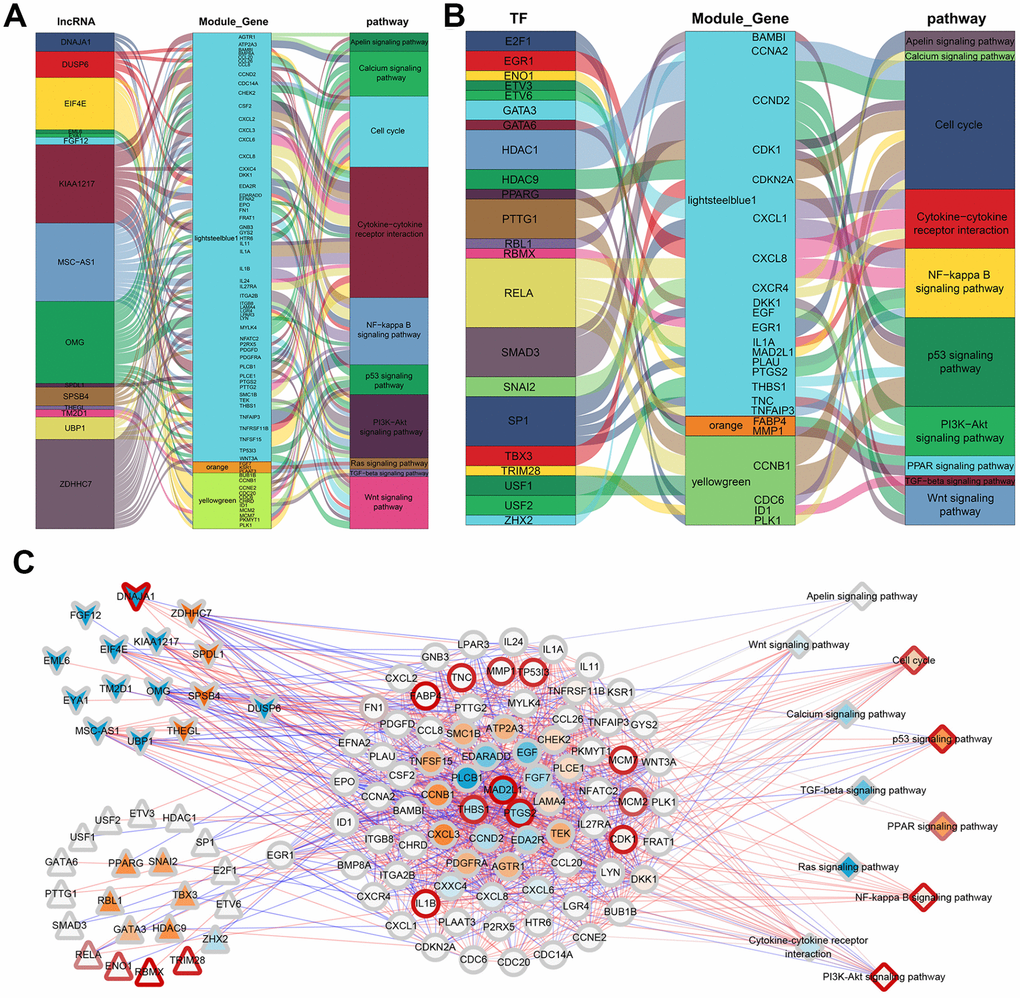
Figure 6.ADSCs’ integrated regulatory network. (A) Sankey plot of gene module regulation by lncRNAs. Each square on the left represents a lncRNA, where the middle square represents a modular gene and the right square represents the pathway. (B) Map of gene module regulation by TFs. Each square on the left represents a TF, where the middle square represents a modular gene and the right square represents a pathway. (C) Integrated regulatory network of lncRNA/TF-target genes-pathways. Squares represent pathways; circles represent modular genes; arrows represent lncRNA; and triangles represent TFs.