Submit an Article
Navigate
Home
Editorial Board
Editorial Policies
Current Volume
Archive
Scientific Integrity
Publication Ethics Statements
Interviews with Outstanding Authors
Newsroom
Sponsored Conferences
Podcast
Contact
Special Collections
Submit an Article
Online ISSN: 1945-4589
Research Paper
|
Volume 12, Issue 19
|
pp. 19316–19324
SYNE1 mutation may enhance the response to immune checkpoint blockade therapy in clear cell renal cell carcinoma patients
Back to article
Figure 3
(4 of 5)
−
100%
+
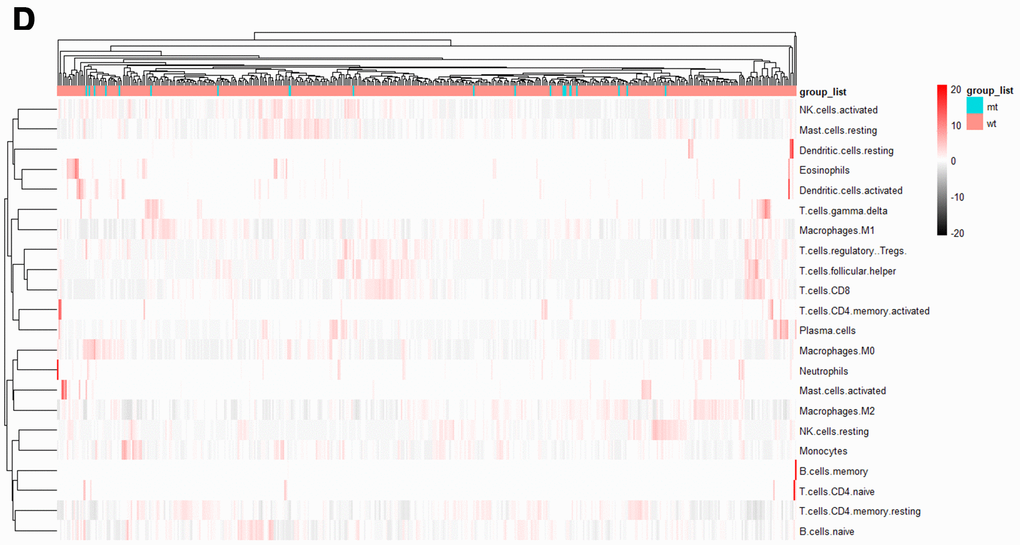
Figure 3.
Tumor-infiltrating immune cells associated with SYNE1 mutation in ccRCC.
(
D
) Heatmap of 22 immune cell types based on SYNE1 mutation. The blue color represents the mt group, and red represents the wt group.