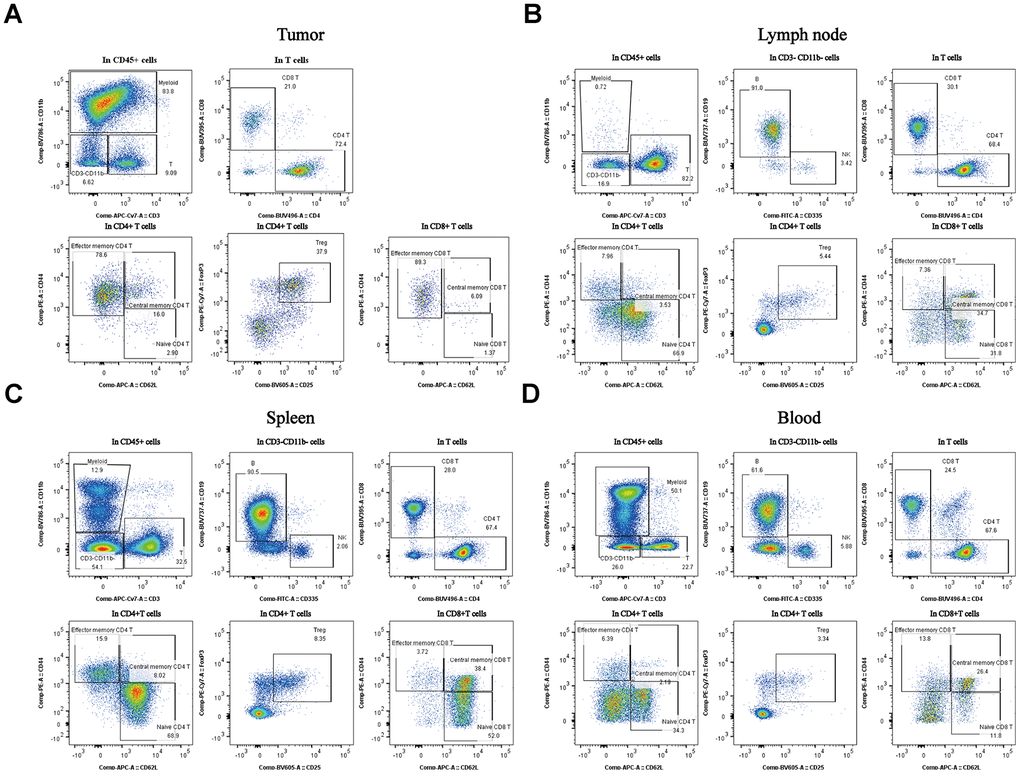
Figure 3.Percentages of the different subpopulations and expression levels in different tissues of the subcutaneous xenograft model. Distribution of immune cell subpopulations in the tumor, spleen, lymph node, and blood isolated from the same tumor progression animal model (CT26 cells). The gating schema for the study and the percentage of immune cell subpopulations in TILs (A), lymph node (B), spleen (C), and peripheral blood (D).