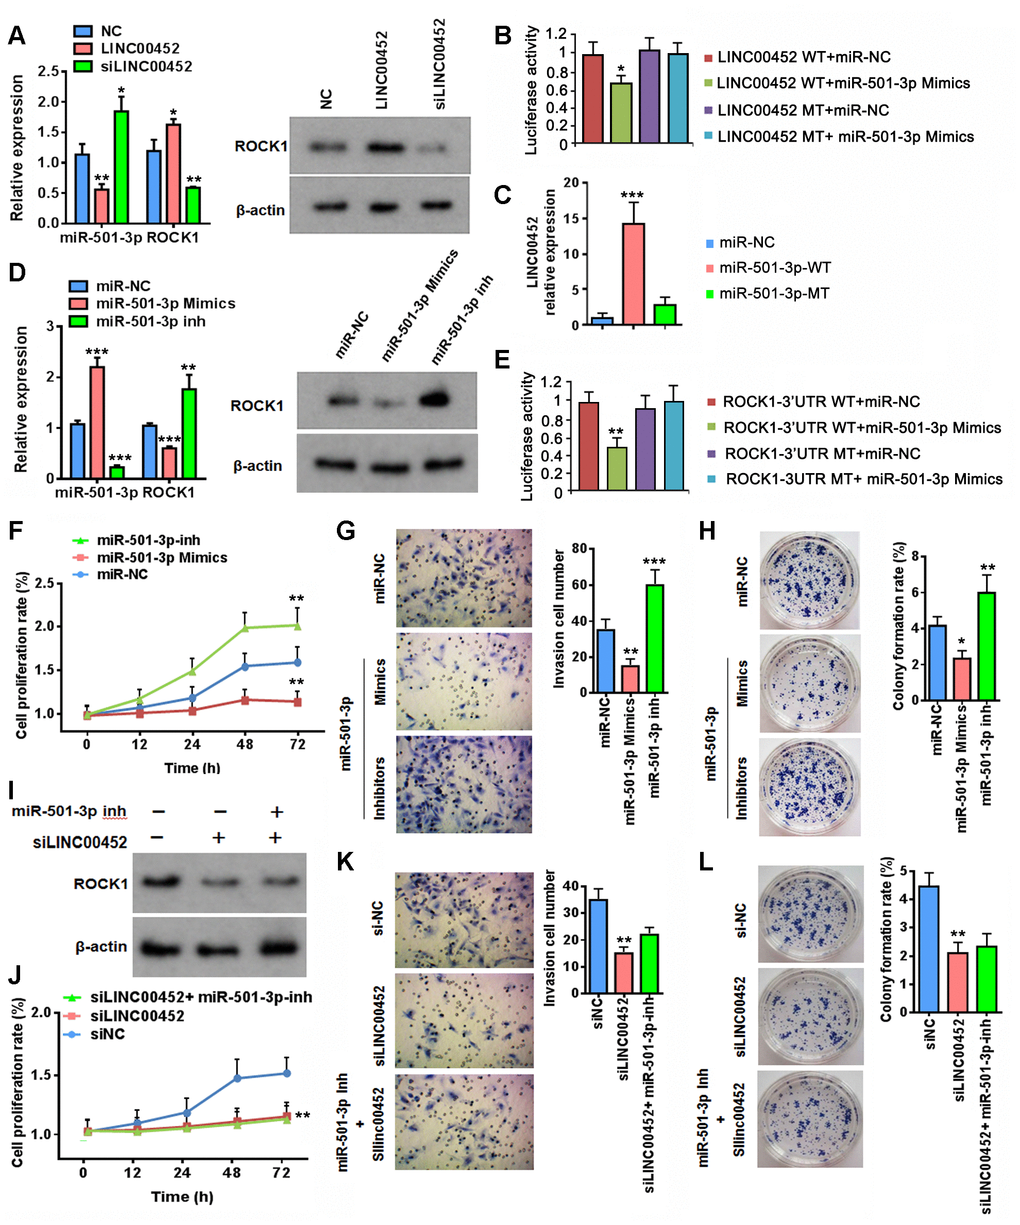
Figure 3.LINC00452 regulates ROCK1 expression through competitive binding of miR-501-3p. (A) Changes at RNA level of miR-501-3p and ROCK1 (left) as well as protein level of ROCK1 (right) upon overexpressing or knockdown LINC00452, respectively. * p < 0.05, ** p < 0.01 versus the corresponding vector-transfected control, one-way ANOVA test. (B) Luciferase reporter assay showing that miR-501-3p mimics reduced the luciferase activity of wild-type LINC00452 reporter, but not the construct with mutations at the binding sites. * p < 0.05 versus WT or MT vector-transfected controls, one-way ANOVA test. WT, wild-type; MT, mutant type. (C) RNA pull-down assay by incubating CaOV3 cell lysates with biotin-labeled wild-type (WT) or mutant (Mu) miR-501-3p followed with qPCR determining LINC00452 level from respective pull-down RNA extract. *** p < 0.001 versus miR-NC, one-way ANOVA test. (D) Determining ROCK1 RNA (left) and protein (right) expression upon transfection of miR-501-3p mimics or inhibitors (inh) in CaOV3 cells. ** p < 0.01, *** p < 0.001 versus control vector transfected cells, one-way ANOVA test. (E) Luciferase reporter assay showing that miR-501-3p mimics reduced the luciferase activity of wild-type ROCK1 reporter, but not the construct with mutations at the binding sites. ** p < 0.01 versus WT or MT vector-transfected controls, one-way ANOVA test. WT, wild-type; MT, mutant type. (F) Time-dependent cell proliferation determined by MTT assay. Cells transfected with miR-501-3p inhibitors exhibited advanced growth over the control vector-transfected CaOV3 cells. In contrast, miR-501-3p inhibitor-transfected cells displayed defective growth. ** p < 0.01 versus miR-NC, one-way ANOVA test. (G) Transwell assay determining cell migration/invasion capacity. Upregulation of miR-501-3p using mimics suppressed whereas downregulation of miR-501-3p by inhibitors promoted cell migration and invasion of CaOV3 cells. ** p < 0.01, *** p < 0.001 versus miR-NC, one-way ANOVA test. (H) Colony-formation assay showing defective cell growth upon transfecting miR-501-3p mimics and enhanced cell growth upon transfecting miR-501-3p inhibitors. * p < 0.05, ** p < 0.01 versus miR-NC, one-way ANOVA test. (I) Western blot assay determining ROCK1 protein changes upon downregulation of LINC00452 or combined decreases in both LINC00452 and miR-501-3p. (J–L) Inhibiting miR-501-3p failed in rescuing LINC00452 decrease-caused defects in CaOV3 cell proliferation (J), migration and invasion (K) as well as growth (H). ** p < 0.01 versus siNC group, one-way ANOVA test.