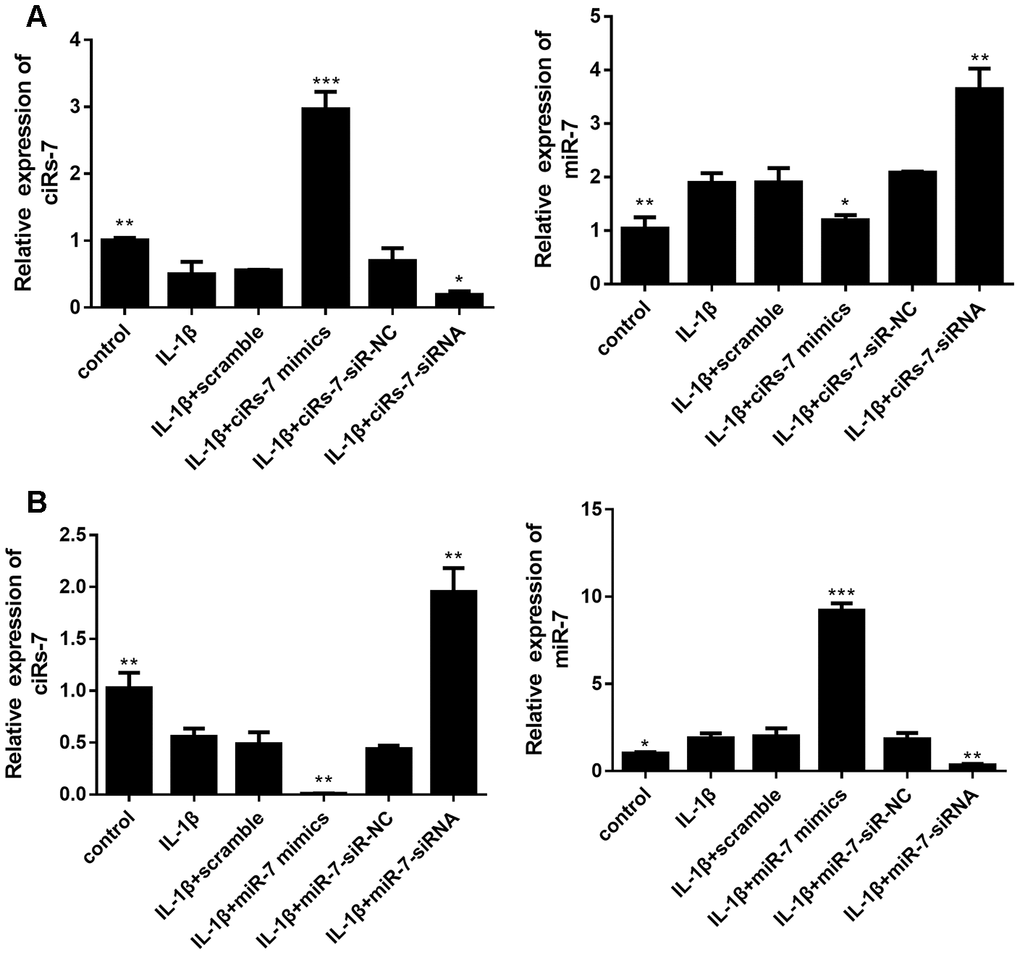
Figure 3.Levels of ciRS-7 and miR-7 in chondrocytes with different transfections: ciRS-7 related transfections (A) and miR-7 related transfections (B). Data represent the mean ± SD (n=3), * p < 0.05, ** p < 0.01 and *** p < 0.001 vs. the IL-1β group.