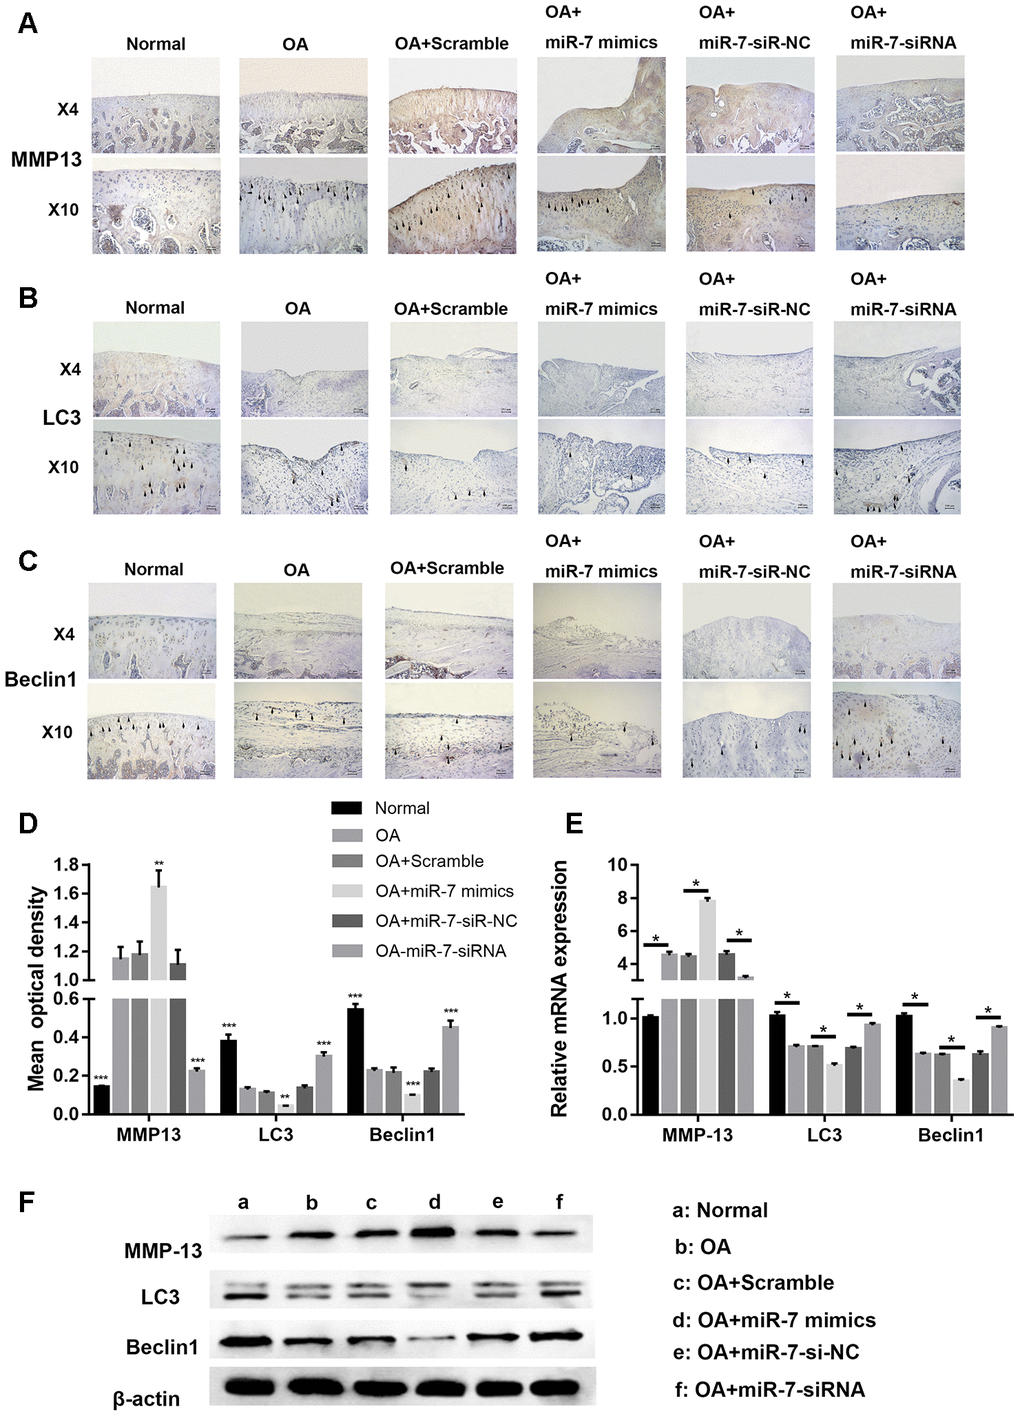
Figure 14.Representative images of immunohistochemical staining for (A) MMP13, (B) LC3, and (C) Bcelin1; (D) Quantitative optical density analysis of immunohistochemical staining for different groups; (E) mRNA and (F) protein expression of MMP13, LC3, and Beclin1. Data represent the mean ± SD (n = 10), ** p < 0.01 and *** p < 0.001 vs. the IL-1β group.