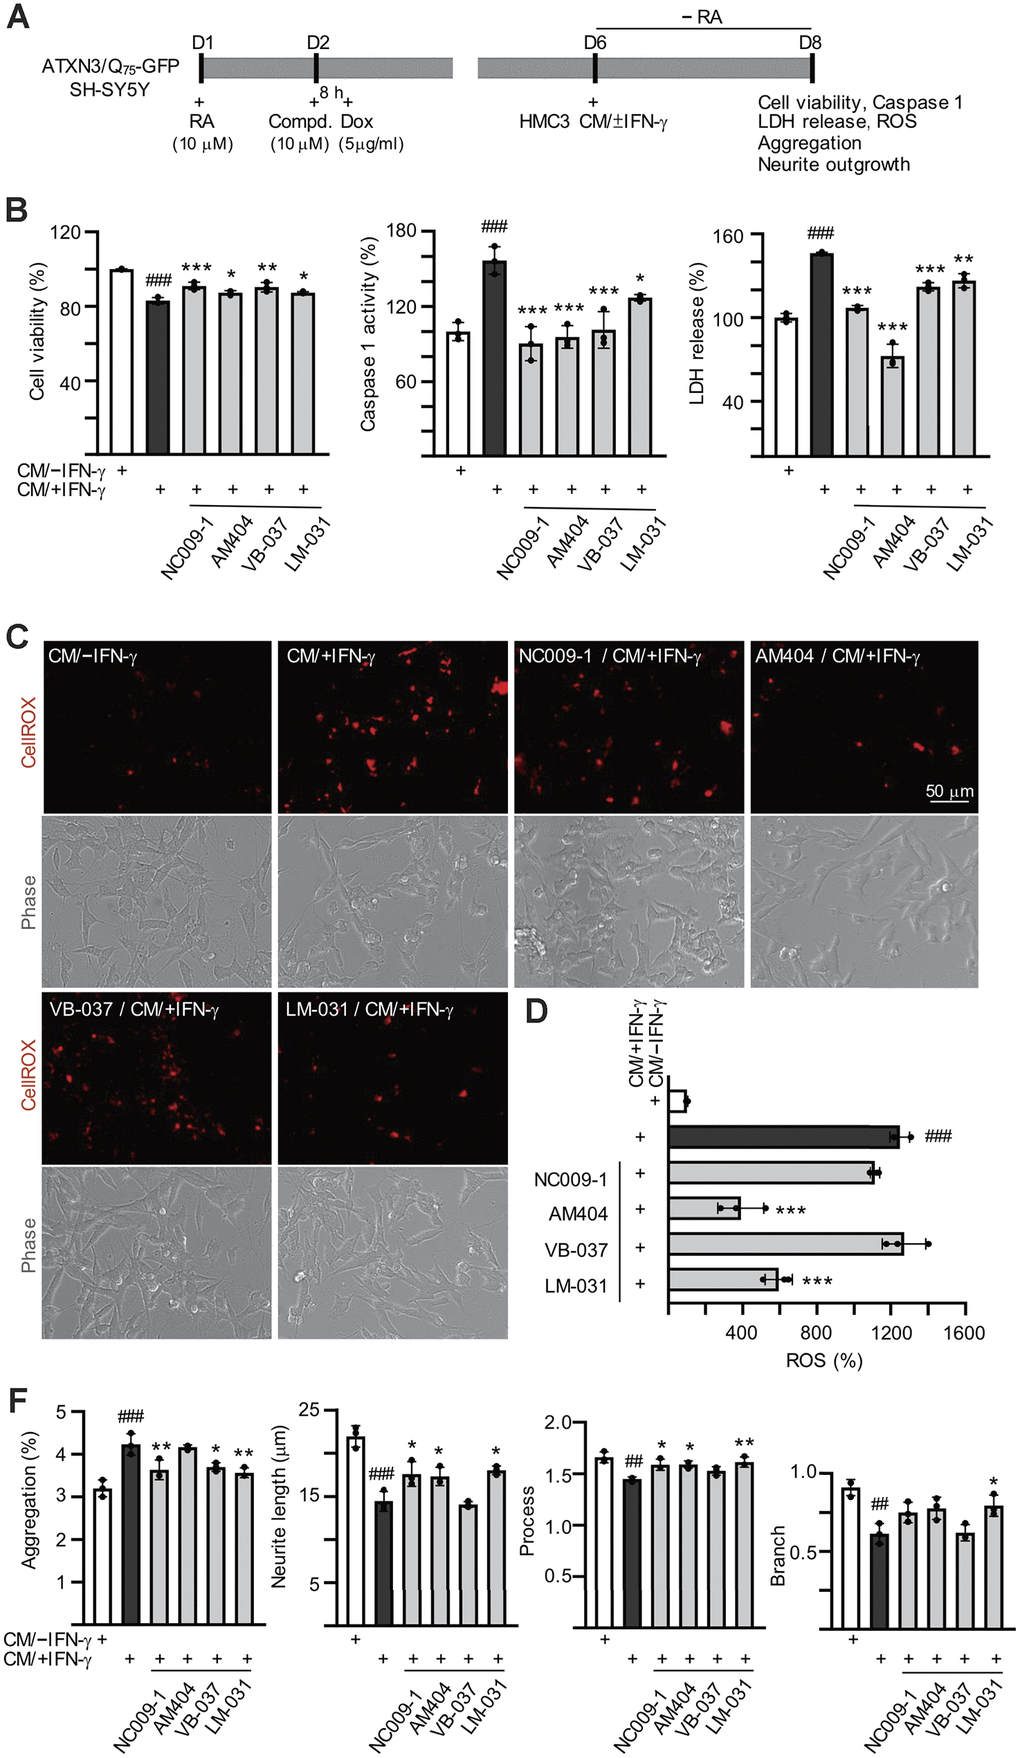
Figure 4.Effects of the tested compounds in ATXN3/Q75-GFP-expressing SH-SY5Y cells inflamed with IFN-γ-stimulated HMC3 conditioned medium. Experimental flowchart (A). ATXN3/Q75-GFP SH-SY5Y cells were plated in media with retinoic acid (RA, 10 μM) on day 1, and treated with the tested compound (10 μM) next day for 8 h, followed by doxycycline addition (Dox, 5 μg/ml) to induce ATXN3/Q75 expression. On day 6, DMEM-F12 medium without retinoic acid addition (− RA) was mixed with HMC3 conditioned medium with or without IFN-γ stimulation (CM/+IFN-γ or CM/–IFN-γ, 1:1 ratio) and added to the cells for 2 days. Cell viability, caspase 1 activity, LDH release (B), ROS (D), polyQ aggregation, neurite length, process and branch (F) were assessed on day 8 (n = 3). For normalization, the relative cell viability, caspase 1 activity, LDH release and ROS levels of cells treated with CM/–IFN-γ were set as 100%. (C) Images of ROS assay using CellROX dye (red).
(E) Images of polyQ aggregation and neurite outgrowth, with aggregates marked with arrowheads (white), and segmented images with multi-colored mask to assign each outgrowth to a cell body for neurite outgrowth quantification. P values: comparisons between cells stimulated with CM/+IFN-γ and CM/–IFN-γ (##: P < 0.01 and ###: P < 0.001), or between compound treated and untreated cells (*: P < 0.05, **: P < 0.01 and ***: P < 0.001). (one-way ANOVA with a post hoc Tukey test).