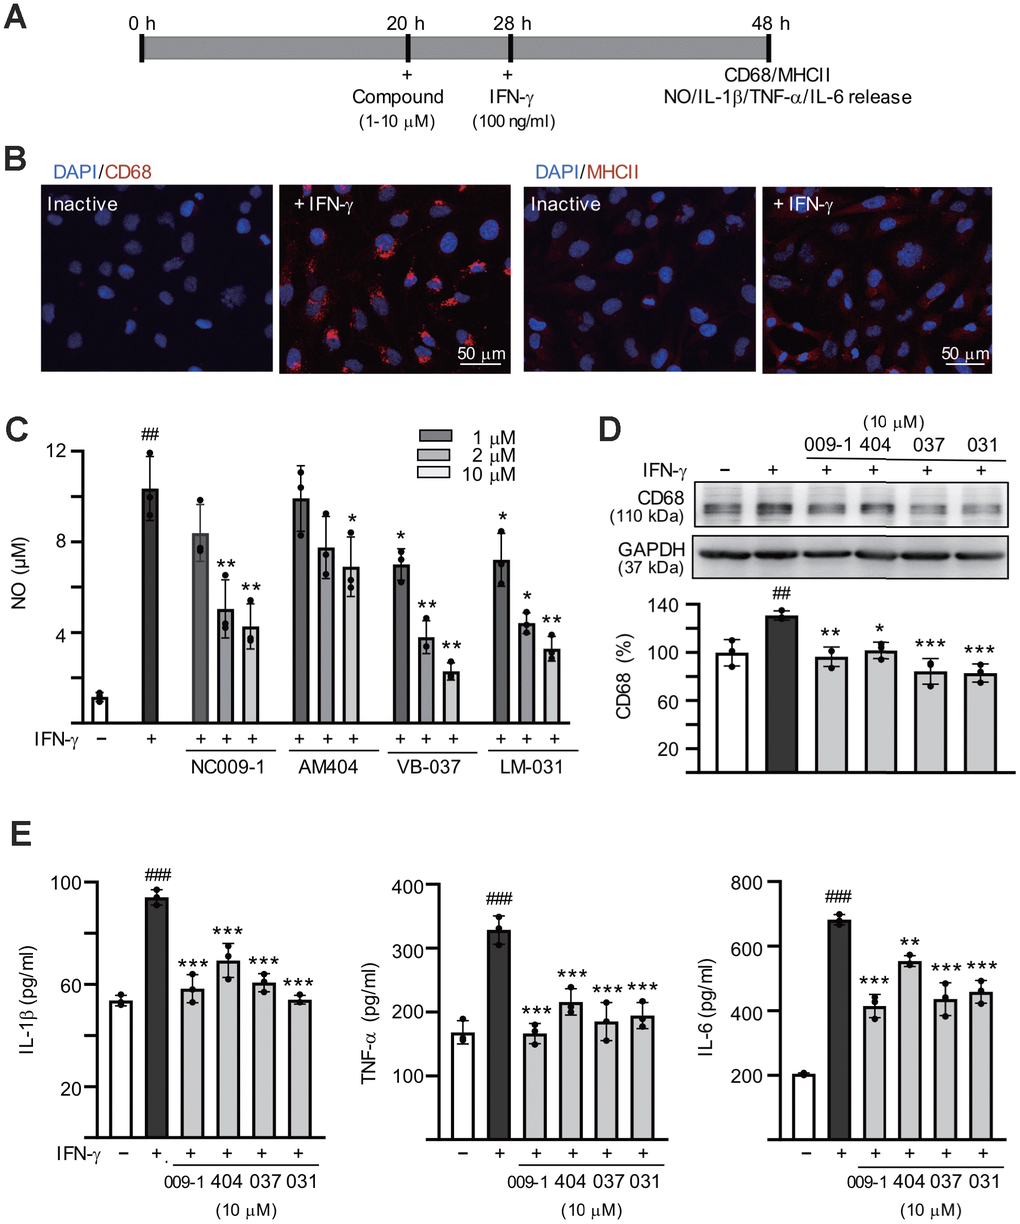
Figure 2.Anti-inflammatory activities of the tested compounds on human HMC3 microglia. (A) Experimental flow chart. HMC3 cells were pretreated with or without each of the tested compounds (1−10 μM) for 8 h, followed by addition of IFN-γ (100 ng/ml) to induce inflammation. After 20 h, CD68 and HMCII expression in cells as well as NO, IL-1β, TNF-α and IL-6 release in culture media were examined. (B) HMC3 cells with or without IFN-γ activation were analyzed by immunofluorescence using antibodies against CD68 and HMCII (red). Cell nuclei were counterstained with DAPI (blue). (C) Levels of NO released into culture media were measured by Griess reagent (n = 3). (D) Relative CD68 levels in cells treated with compound (10 μM) or not were analyzed by immunoblotting, using GAPDH as a loading control (n = 3). (E) IFN-γ-activated HMC3 cells were pretreated with the tested compounds (10 μM) and relative levels of IL-1β, TNF-α and IL-6 released into culture media were assessed by ELISA (n = 3). For normalization, the relative CD68, IL-1β, TNF-α and IL-6 levels of untreated cells (no IFN-γ activation) were set as 100%. P values: comparisons between IFN-γ activated and inactive cells (##: P < 0.01 and ###: P < 0.001) or between compound treated and untreated cells (*: P < 0.05, **: P < 0.01 and ***: p < 0.001). (one-way ANOVA with a post hoc Tukey test).