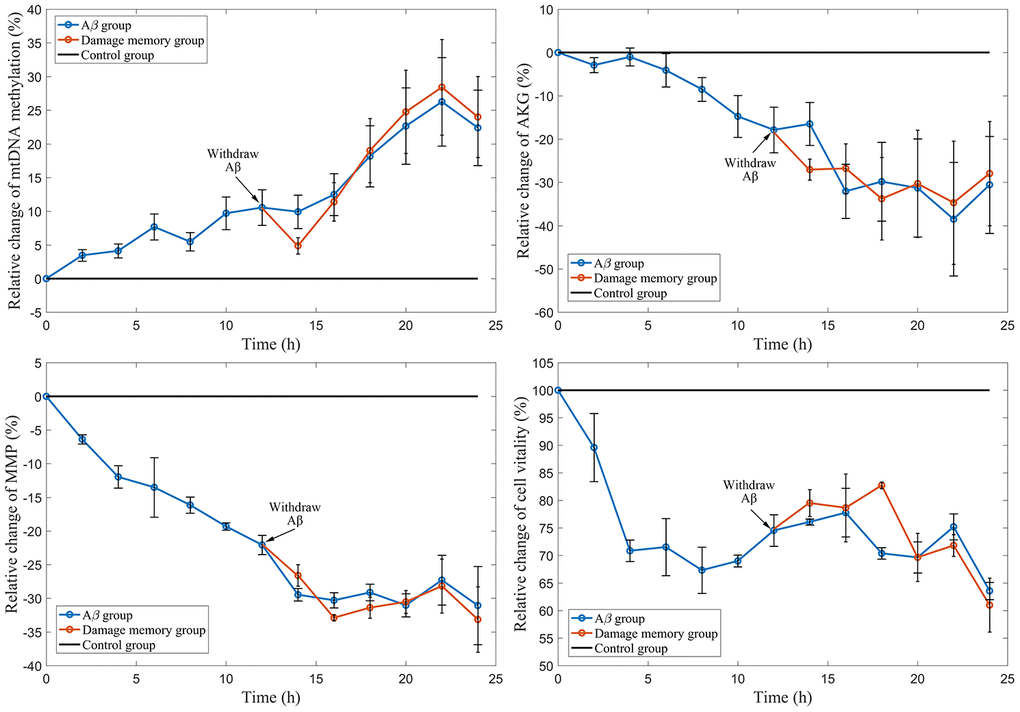
Figure 2.The time course of relative change of mtDNA methylation, AKG, MMP, and cell vitality compared to the control group. The black line represent the control group level which is normalized to 100%. The blue line represent Aβ group level. The red line represent the damage memory group.