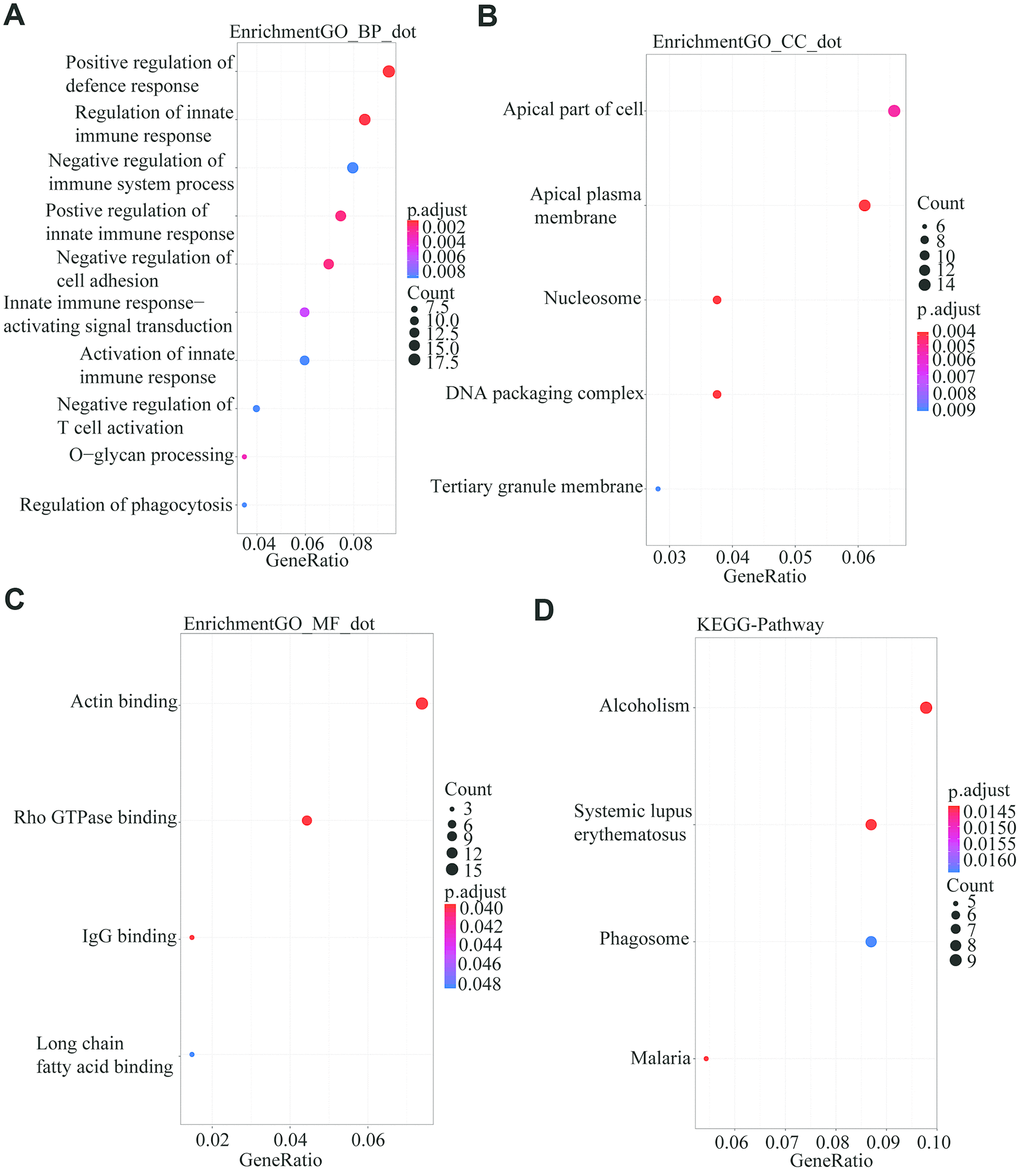
Figure 3.GO and KEGG analysis using the R package “Clusterprofile” for the 222 common DGEs from the three databases. P<0.05 was set as the threshold. (A) Biological process. (B) Cell component. (C) Molecular Function. (D) Kyoto Encyclopedia of Genes and Genomes.