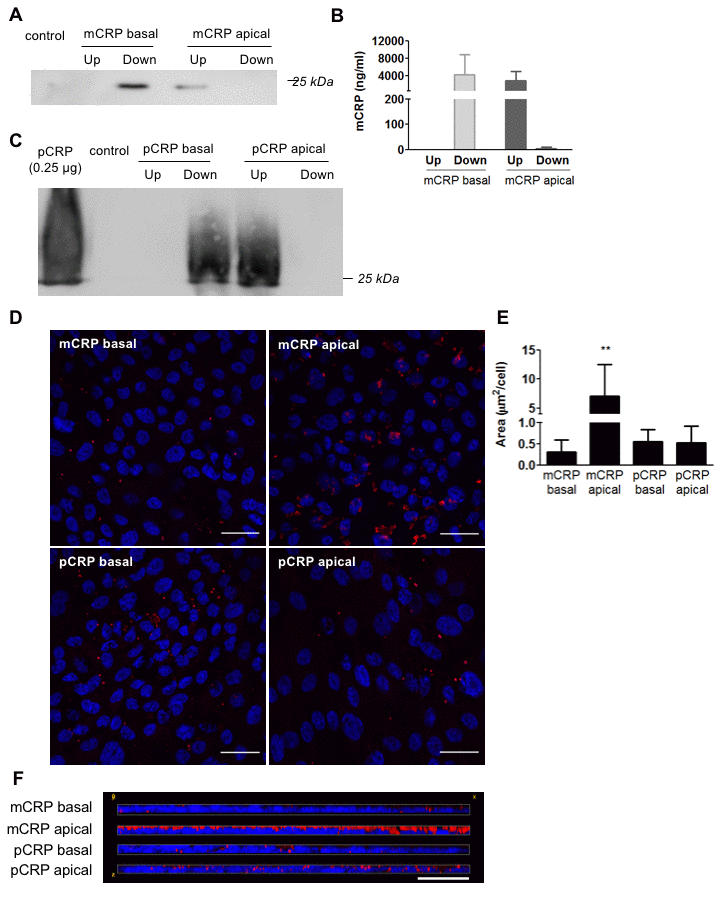
Figure 3.Diffusion of CRP isoforms across primary porcine RPE cells. (A) Western blot of mCRP present in apical (Up) and basolateral (Down) supernatants 48 hours after addition of mCRP (N=4). (B) ELISA of mCRP (ng/ml) from apical (Up) and basolateral (Down) supernatants. Values are expressed as mean ± SD (N=5). (C) Western blot of pCRP present in apical (Up) and basolateral (Down) supernatants 48 hours after treatment (N=3). (D) Immunofluorescence of CRP (red) stained with monoclonal antibodies against mCRP (3H12) or pCRP (1C6). Nuclei stained with DAPI. Scale bar = 30 μm (N=3). (E) Quantification of CRP binding measured as stained area divided by the number of cells per image (μm2/cell). Results are expressed as mean area (μm2/cell) ± SD. Statistical analysis was performed by One-Way ANOVA and Tukey’s posthoc. **P<0.01 vs. all conditions. (F) Reconstruction of x-z sections with a 0.3 μm z axis step of immunofluorescence images. Images shown are representative of three independent experiments.