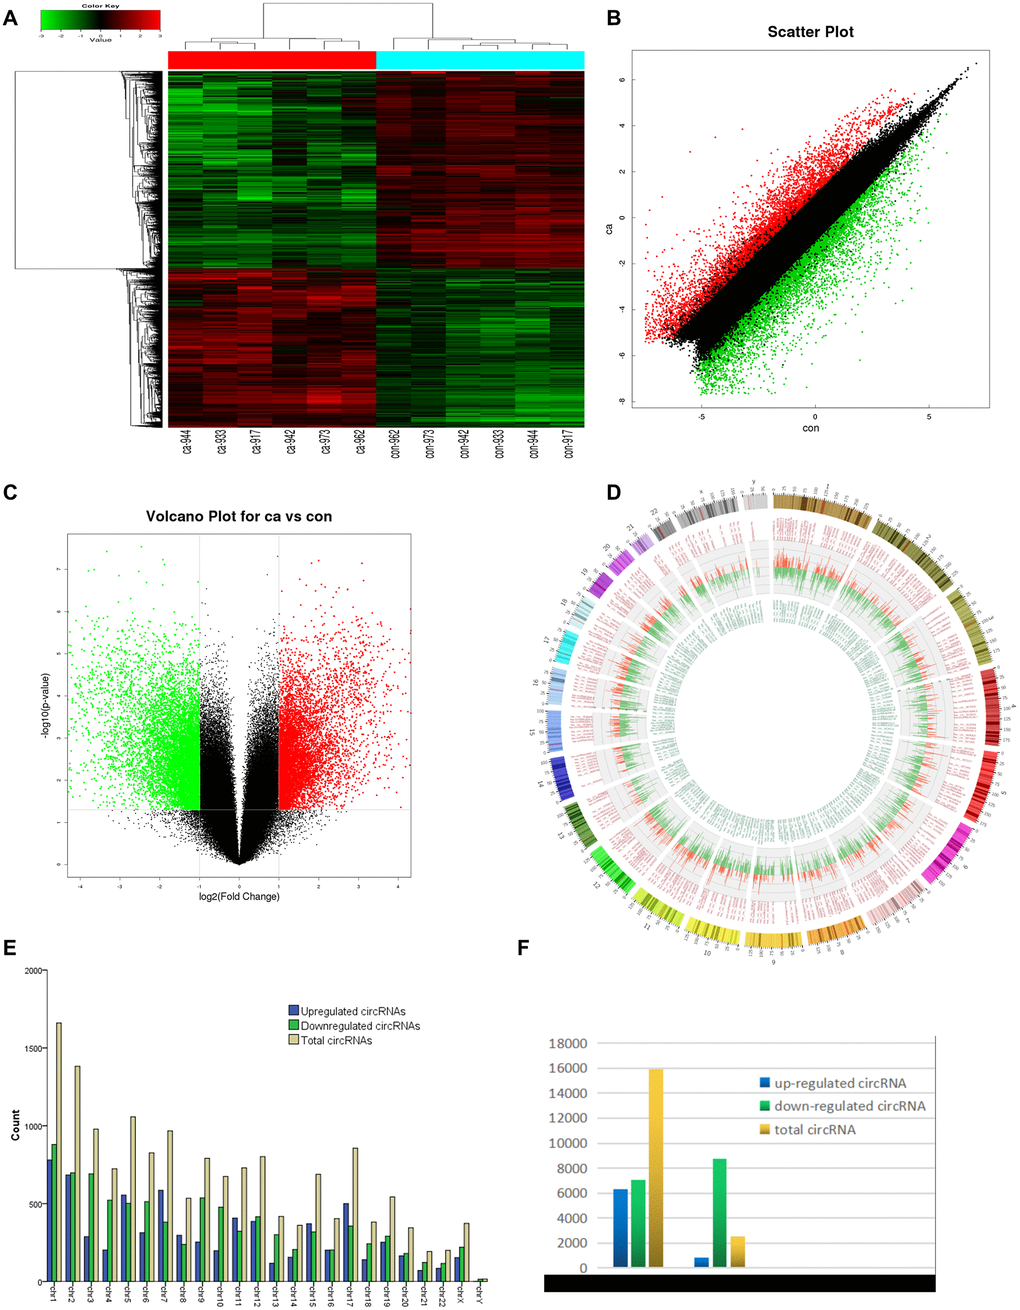
Figure 2.circRNA expression profile differences between ESCC and paired adjacent normal tissues. (A) Hierarchical clustering of circRNA expression profiles across samples. Each column is a tissue sample, and each row is a circRNA. (B) Scatter plot of differences in circRNA expression in ESCC and normal tissues. (C) Volcano plot showing dysregulated circRNAs. (D) Circos plot indicating differentially expressed circRNAs. Column width represents the number of differentially expressed circRNAs, and the column length the degree of differential expression. (E) Chromosomal distributions of differentially expressed circRNAs. Blue, green, and yellow represent upregulated, downregulated, and total circRNAs, respectively. (F) CircRNA source: 84.02% of dysregulated circRNAs originated from exons. Ca=ESCC tissues; Con=adjacent normal tissues. Red and green indicate upregulated and downregulated circRNAs, respectively.