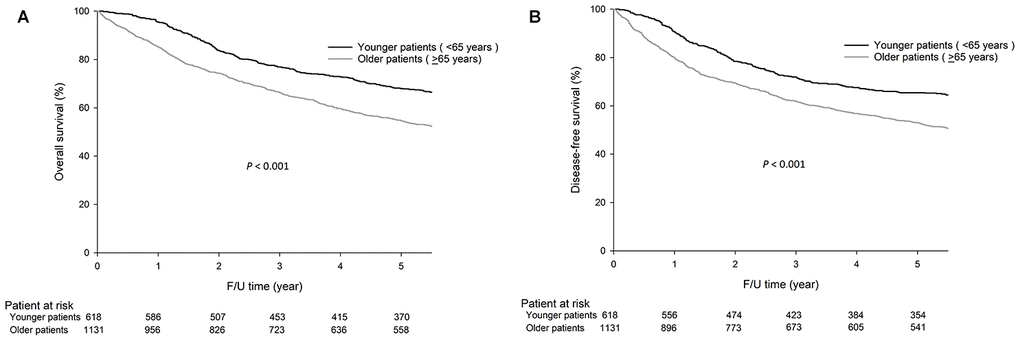
Figure 1.The 5-year OS (68.0% vs. 54.6%, P<0.001) and DFS (65.4% vs. 53.0%, P<0.001) rates were significantly higher in younger patients (<65 years) than in older patients (≥65 years). The survival curves are shown as follows: (A) OS curves of GC patients. (B) DFS curves of GC patients.